pprof介绍与使用
pprof 是用于可视化和分析性能分析数据的工具
pprof 以 profile.proto 读取分析样本的集合,并生成报告以可视化并帮助分析数据(支持文本和图形报告)
profile.proto 是一个 Protocol Buffer v3 的描述文件,它描述了一组 callstack 和 symbolization 信息, 作用是表示统计分析的一组采样的调用栈,是很常见的 stacktrace 配置文件格式
runtime.pprof引入pprof
以下demo演示了如何通过runtime.pprof引入pprof分析内存的使用
import (
    "fmt"
    "log"
    "os"
    "runtime/pprof"
    "unsafe"
)

var userDir = os.Getenv("HOME")

func main() {
    // 申请2GB的内存
    b := make([]byte, 1024*1024*1024*2)
    memLeak(*(*[]int)(unsafe.Pointer(&b)))

    memProfile := fmt.Sprintf("%s/%s", userDir, "memProfile")
    f, err := os.Create(memProfile)
    if err != nil {
        log.Fatalln(err)
    }
    defer f.Close()

    err = pprof.WriteHeapProfile(f)
    if err != nil {
        log.Fatalln(err)
    }
    a = nil
}

var a []int

func memLeak(b []int) []int {
    a = b[:2]
    return a
}
- 在上面的代码中,我们使用了runtime.pprof进行内存的分析
- 运行程序后我们利用pprof分析工具查看内存使用情况
go tool pprof ~/memProfile
go tool pprof <format> [options] [binary] <source> ...
➜  ~ go tool pprof memProfile
Type: inuse_space
Time: Jan 23, 2022 at 9:53pm (CST)
Entering interactive mode (type "help" for commands, "o" for options)
(pprof)
- 我们进入到交互式终端
- top命令会列出最高的占用项,会根据pprof默认过滤情况展示数据
top
(pprof) top
Showing nodes accounting for 2GB, 99.93% of 2GB total
Dropped 14 nodes (cum <= 0.01GB)
      flat  flat%   sum%        cum   cum%
       2GB 99.93% 99.93%        2GB 99.93%  main.main
         0     0% 99.93%        2GB 99.93%  runtime.main
| flat | 函数运行情况 |
|---|---|
| flat% | 函数运行情况占比 |
| sum% | 函数自身累计占比 |
| cum | 函数及调用函数总情况 |
| cum% | 函数自身占用该函数的占比 |
其中,pprof对于内存默认分析的是inuse_space,常用的几种类型如下
-
inuse_space:分析应用程序的常驻内存占用情况
-
alloc_objects:分析应用程序的内存临时分配情况
-
inuse_objects: 每个函数所分别的对象数量
-
alloc_space: 查看分配的内存空间大小
我们可以看到在程序中,常驻内存的容量大小为2GB,均分配到了main.mian函数中,我们想知道2GB分配到了哪里,我们可以通过list命令查看内存分配的具体情况
list main.main
(pprof) list main.main
Total: 2GB
ROUTINE ======================== main.main in /Users/maishuqiang/GolandProjects/ginLearn/main.go
       2GB        2GB (flat, cum) 99.93% of Total
         .          .     10:
         .          .     11:var userDir = os.Getenv("HOME")
         .          .     12:
         .          .     13:func main() {
         .          .     14: // 申请2GB的内存
       2GB        2GB     15: b := make([]byte, 1024*1024*1024*2)
         .          .     16: memLeak(*(*[]int)(unsafe.Pointer(&b)))
         .          .     17:
         .          .     18: memProfile := fmt.Sprintf("%s/%s", userDir, "memProfile")
         .          .     19: f, err := os.Create(memProfile)
         .          .     20: if err != nil {
可以看到我们在内存中分配的2GB的内存使用在了第15行
我们也可以通过traces命令查看函数的调用栈信息
traces main.main
(pprof) traces main.main
Type: inuse_space
Time: Jan 23, 2022 at 9:53pm (CST)
-----------+-------------------------------------------------------
     bytes:  2GB
       2GB   main.main
             runtime.main
-----------+-------------------------------------------------------
以上事例给出了3种在pprof中常用的分析命令
-
top:列出最高的使用情况
-
list:列出函数具体的使用情况
-
traces:列出函数的调用栈信息
我们如何分析程序的goroutine和cpu的使用情况?
针对于上述的例子,我们要如何优化解决内存泄漏的情况?
🤫
net/pprof引入pprof的使用
对于一个运行中的服务器,我们通常使用net/pprof来分析程序的运行情况
以下例子我们通过net/pprof的使用来分析goroutine的情况
import (
    "encoding/json"
    "log"
    "net/http"
    _ "net/http/pprof"
    "os"

    "gorm.io/driver/mysql"
    "gorm.io/gorm"
)

func main() {
    http.HandleFunc("/test", handle)
    if err := http.ListenAndServe(":6060", nil); err != nil {
        return
    }
}

var conn *gorm.DB

func initDB() {
    db, err := gorm.Open(mysql.New(mysql.Config{DSN: os.Getenv("LOCAL_DB")}))
    if err != nil {
        log.Fatalln(err)
    }

    conn = db
}

type T struct {
    Id   uint   `gorm:"primaryKey" json:"id" db:"id"`
    Name string `json:"name"`
    Age  int    `json:"age"`
}

func (t *T) TableName() string {
    return "test1"
}

func getData() (*T, error) {
    initDB()
    t := &T{}
    if err := conn.First(t).Error; err != nil {
        return nil, err
    }
    return t, nil
}

func handle(w http.ResponseWriter, r *http.Request) {
    t, err := getData()
    if err != nil {
        return
    }

    b, _ := json.Marshal(t)
    w.Write(b)
}
- 上述的demo中,我们连接了DB进行数据查询并返回数据
- 注意:在使用net/pprof的使用中,我们要注意import中使用 _ “net/http/pprof”
我们使用浏览器打开监控界面
http://localhost:6060/debug/pprof
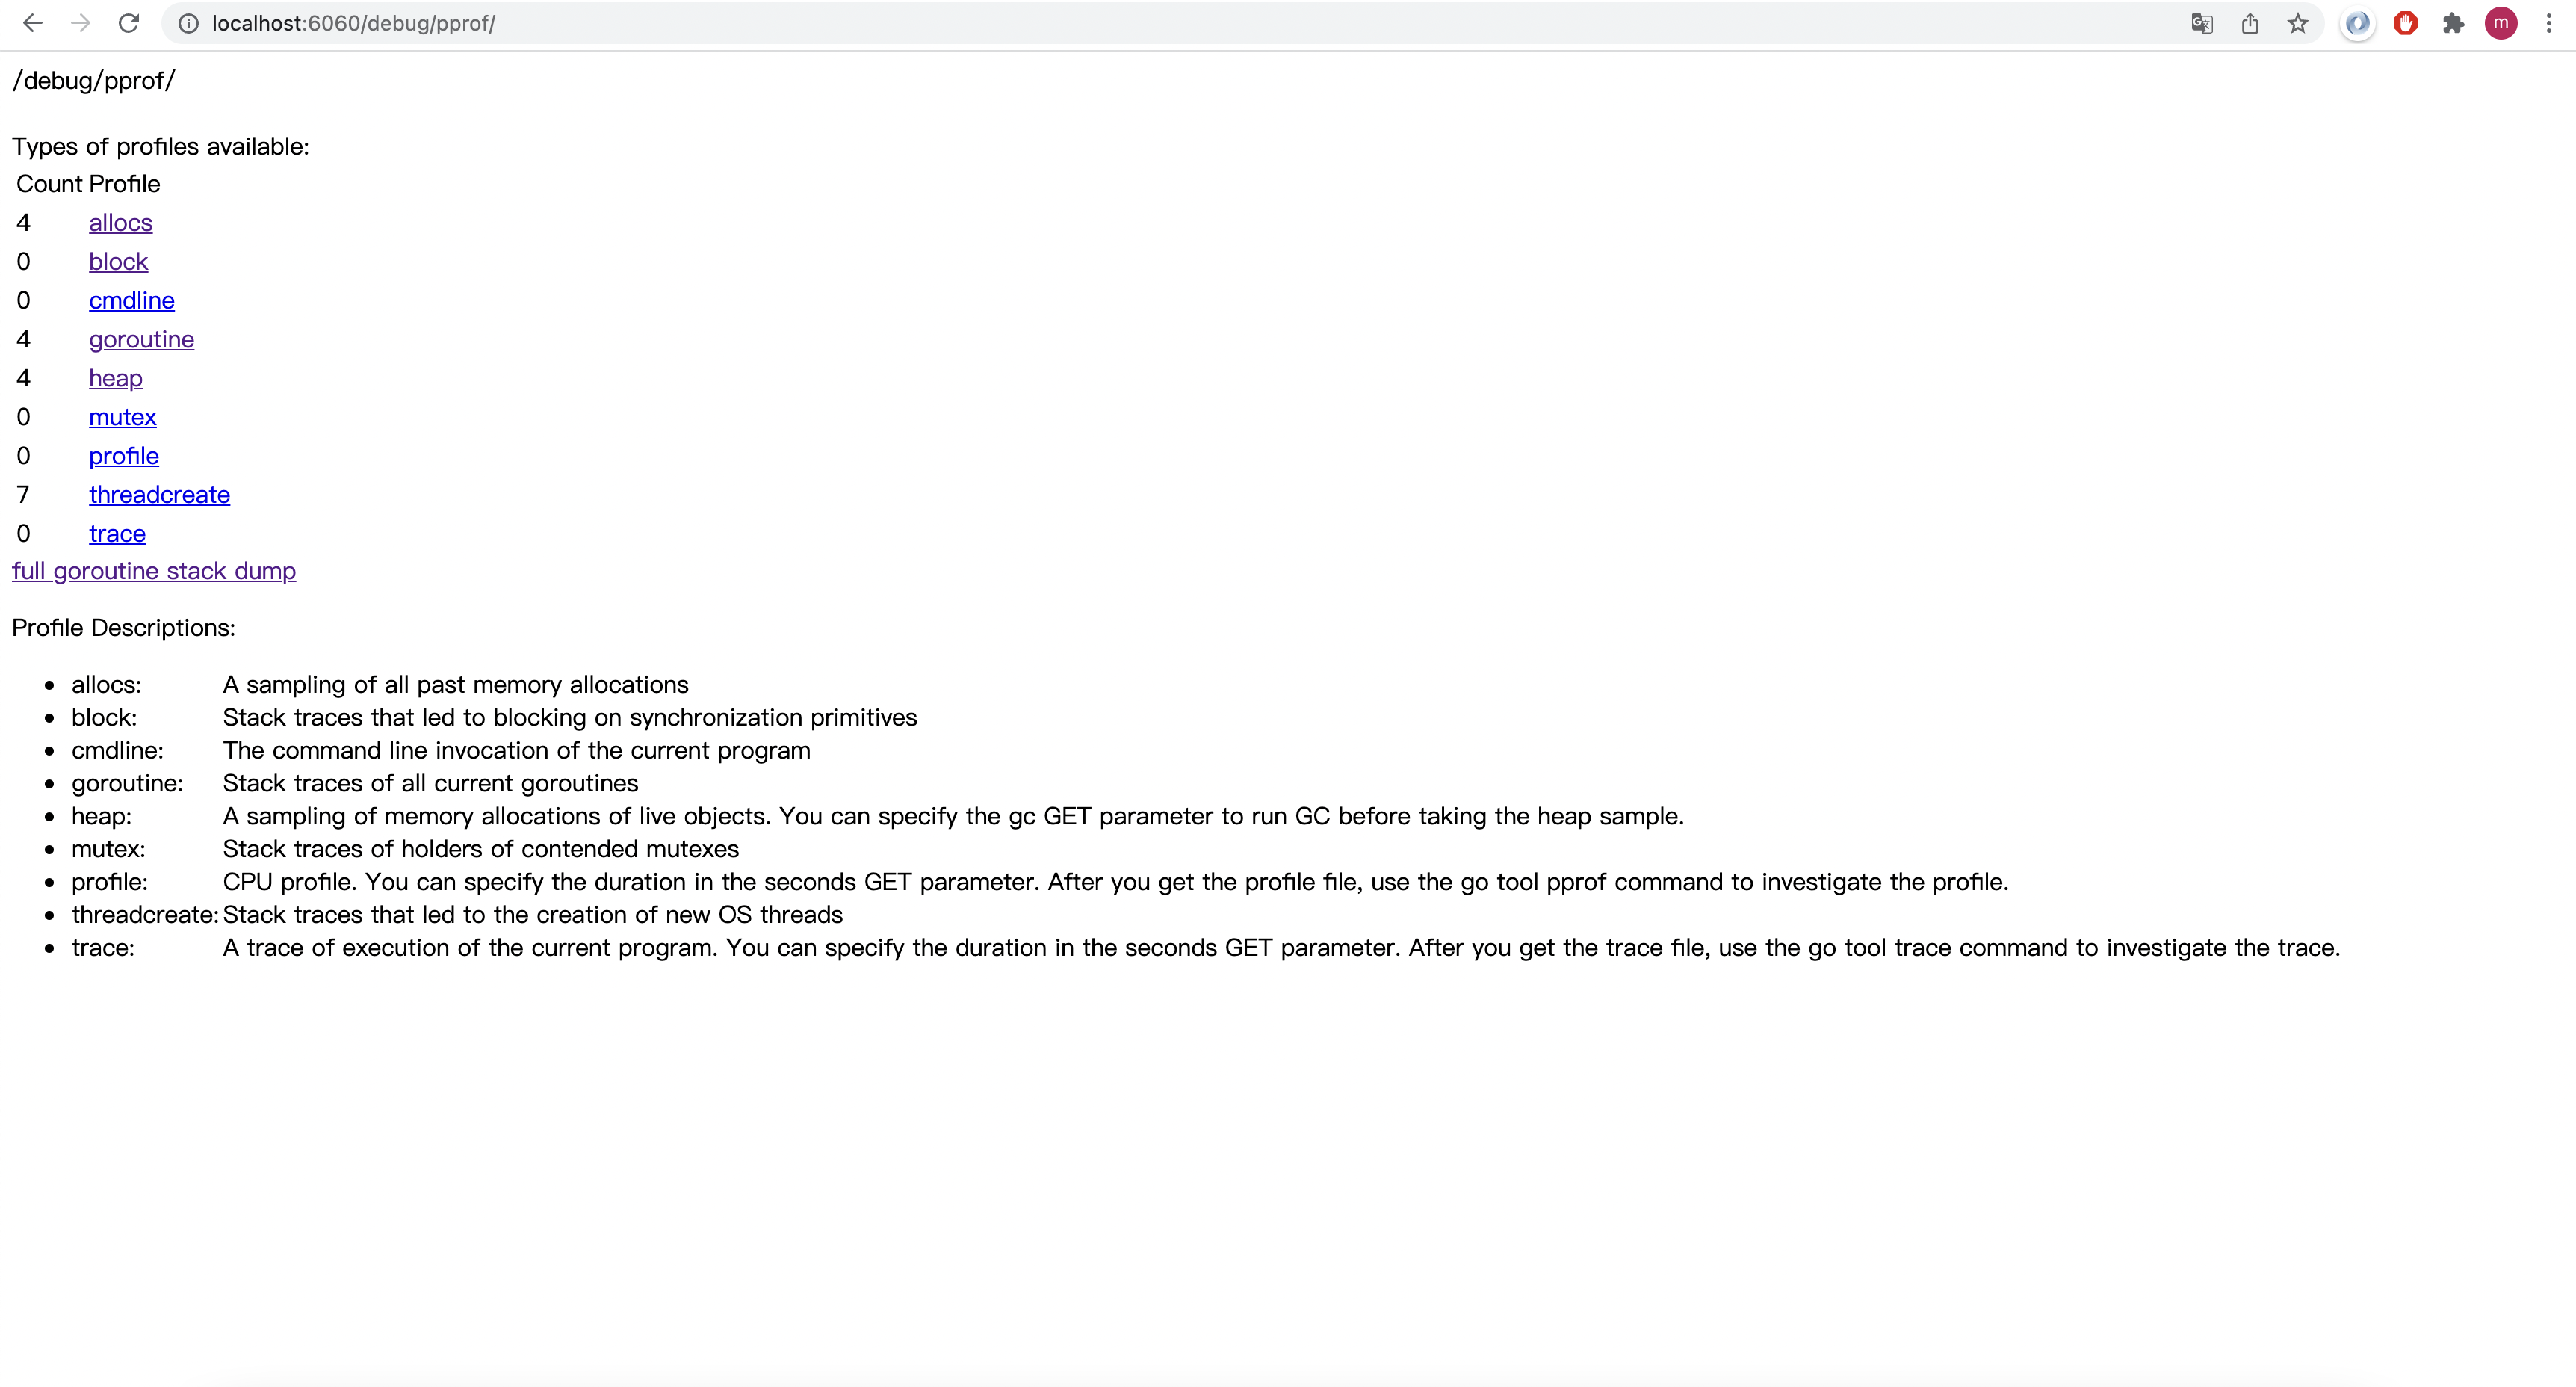
-
图中说明了各个选项的例子,该demo展示的是goroutine,我们主要关注goroutine的数量
-
在程序启动时,可以看到goroutine的数量时4
-
当我们发起请求时,注意查看goroutine的变化
-
http://localhost:6060/test
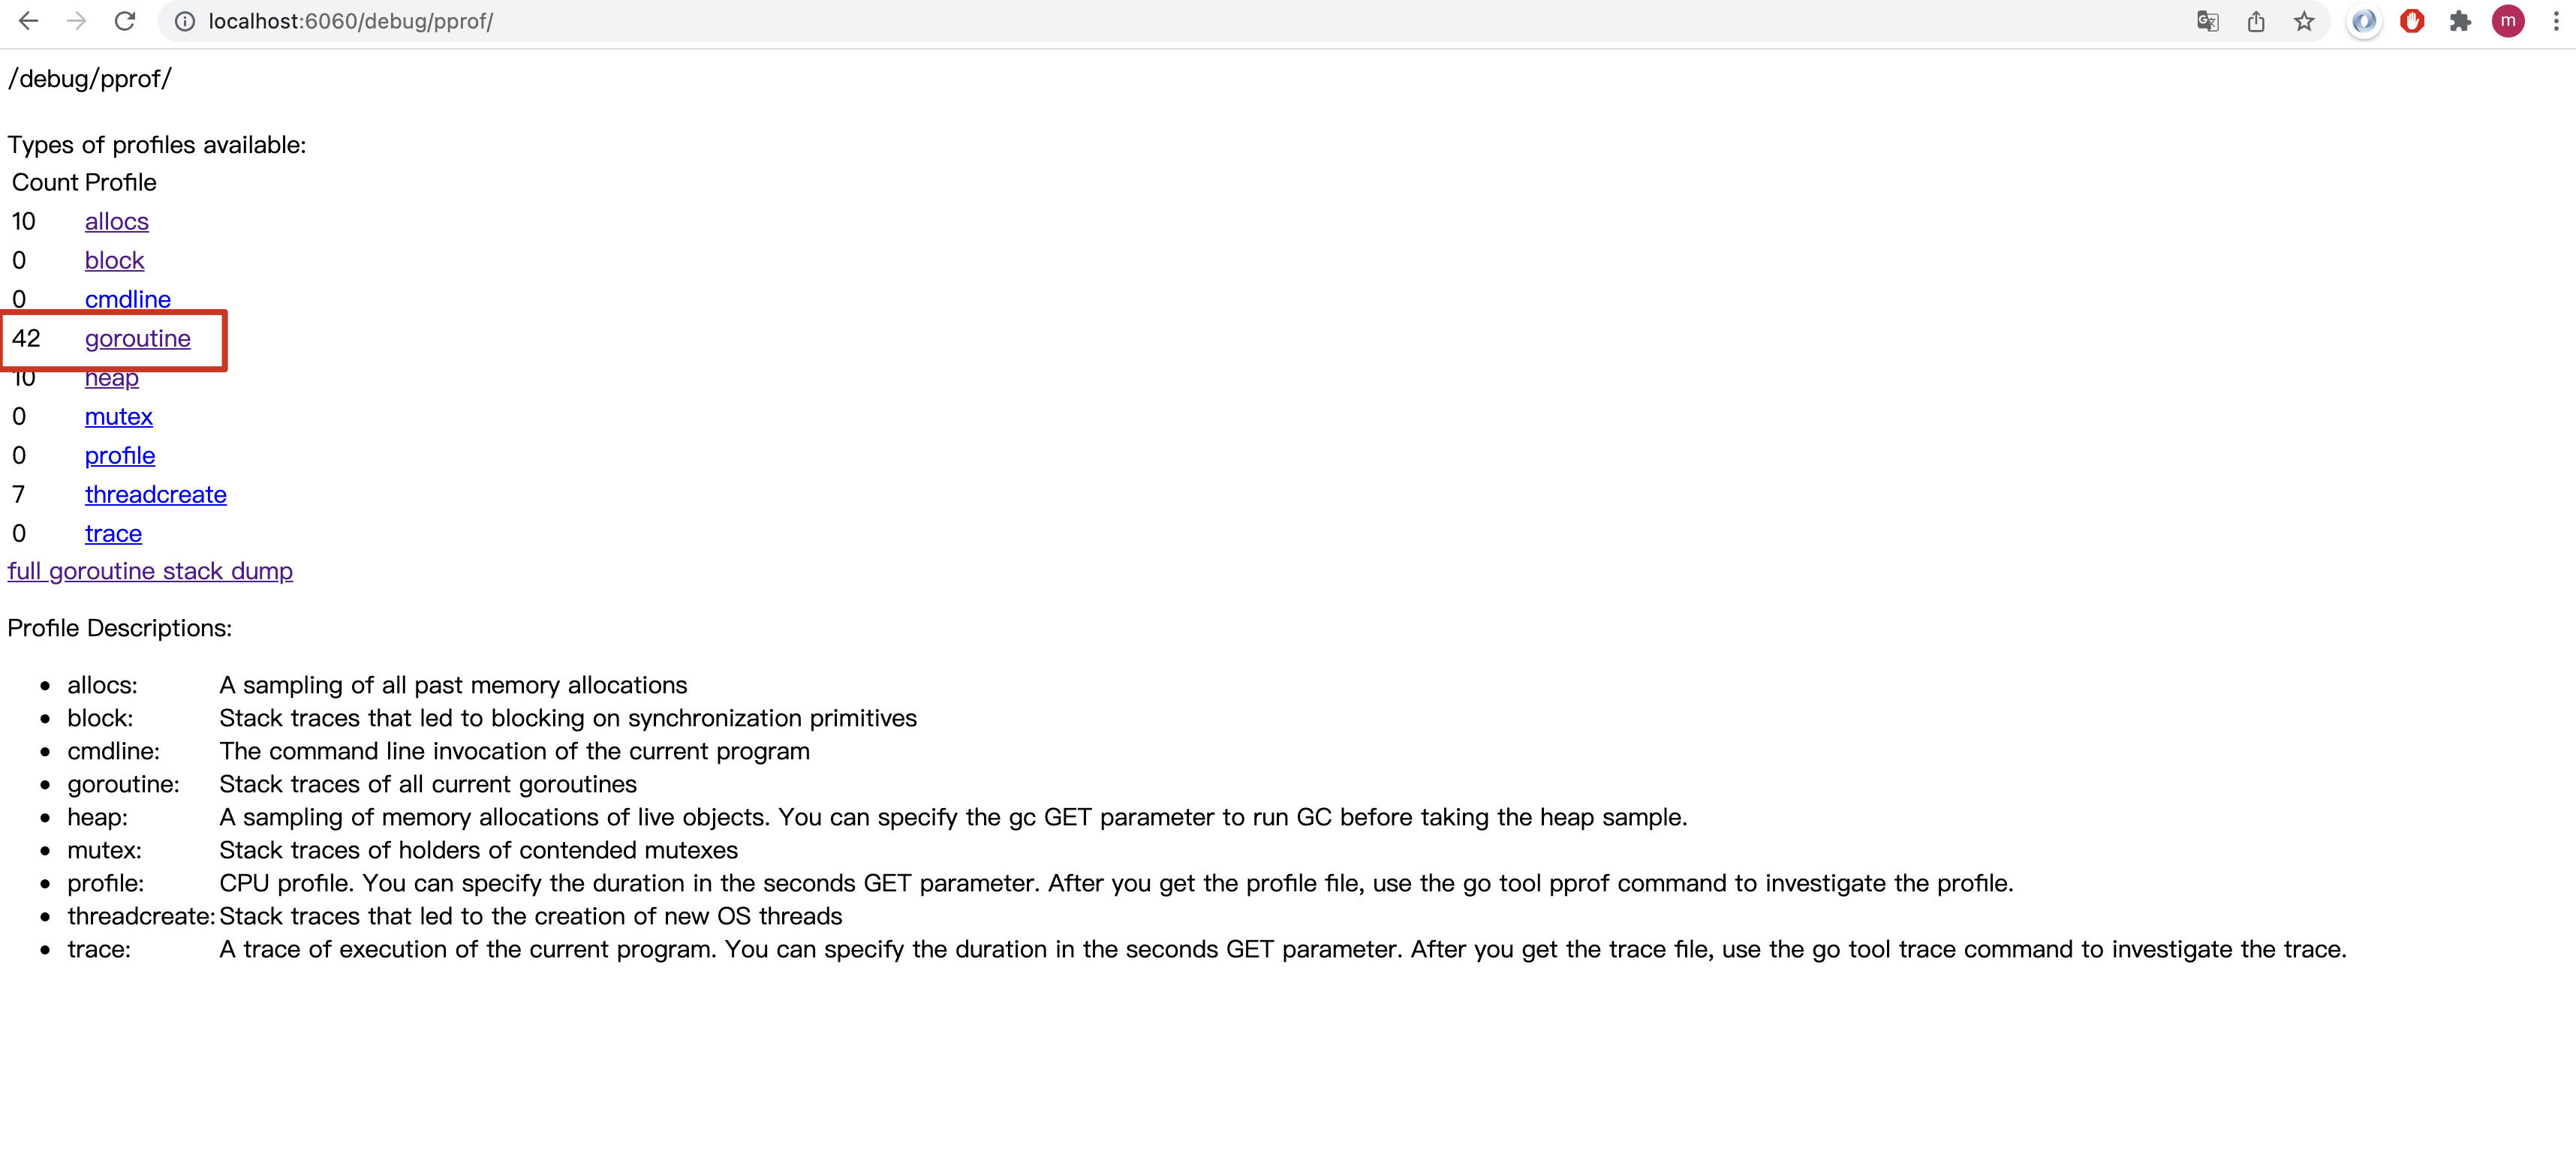
当我们发起了几次请求后,看到程序的goroutine的数量上升到了42,我们想分析这上升的协程是否合理,并且想具体查看协程分配的情况
点击goroutine
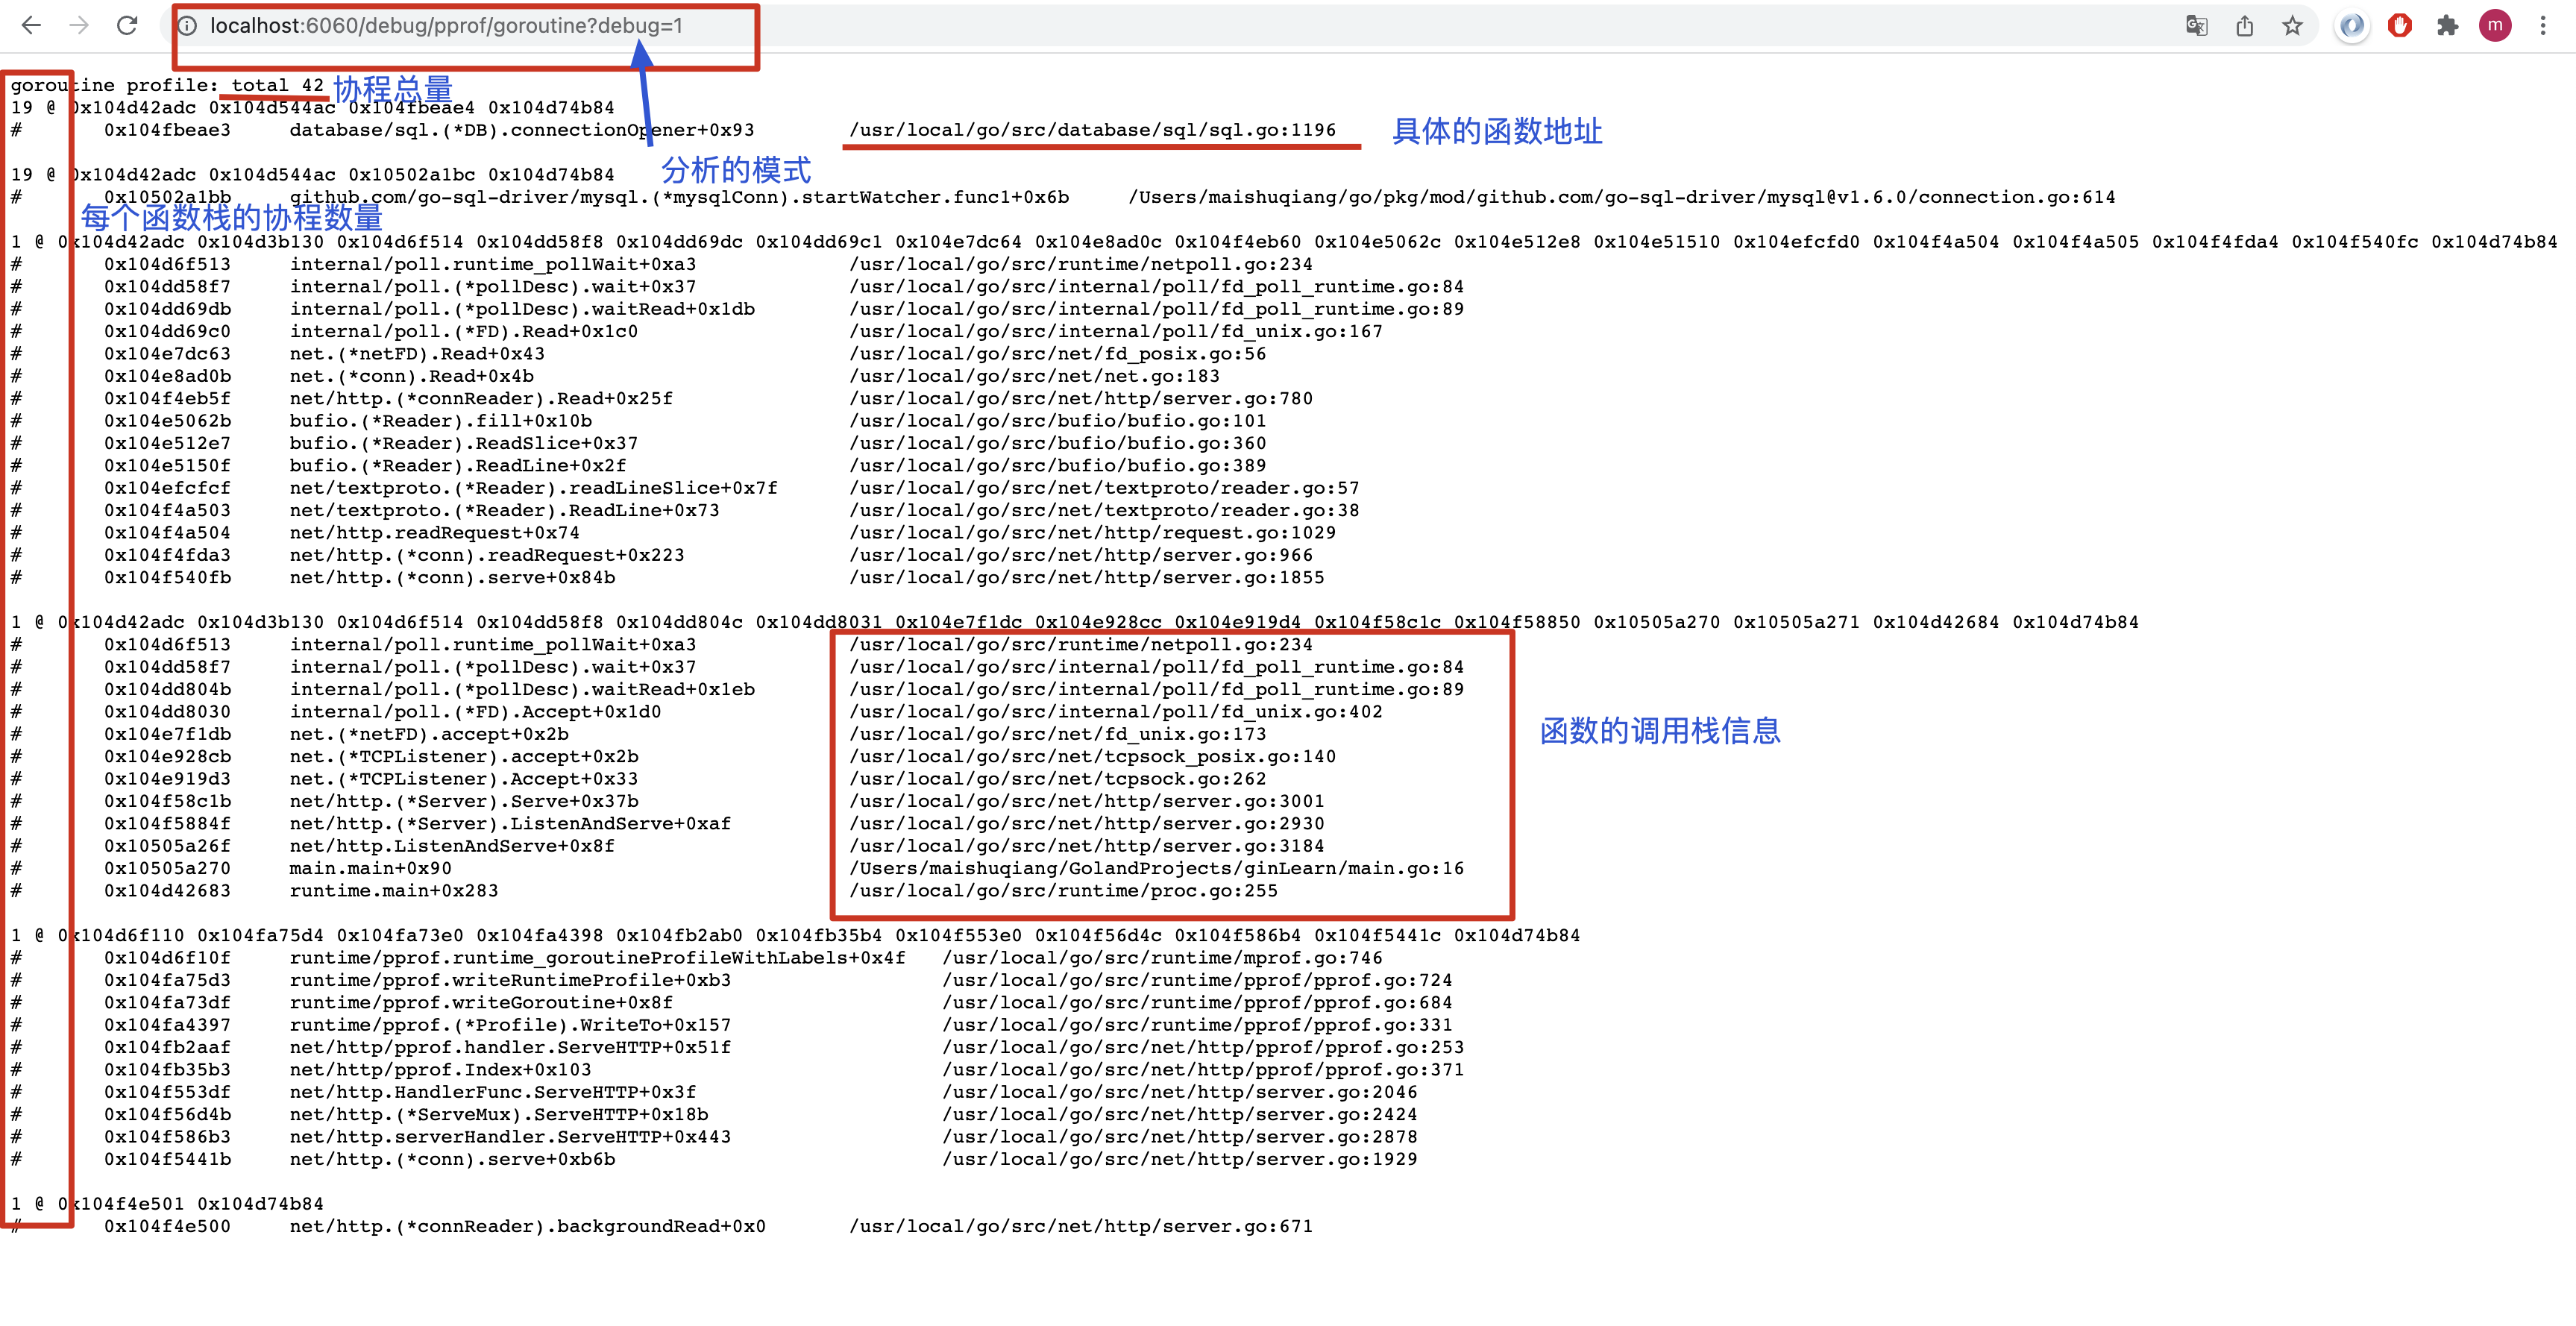
-
我们点击链接后,看到了图中的信息
-
其中debug=1模式介绍了协程的概括情况,可以看到大多数的协程均在连接db上
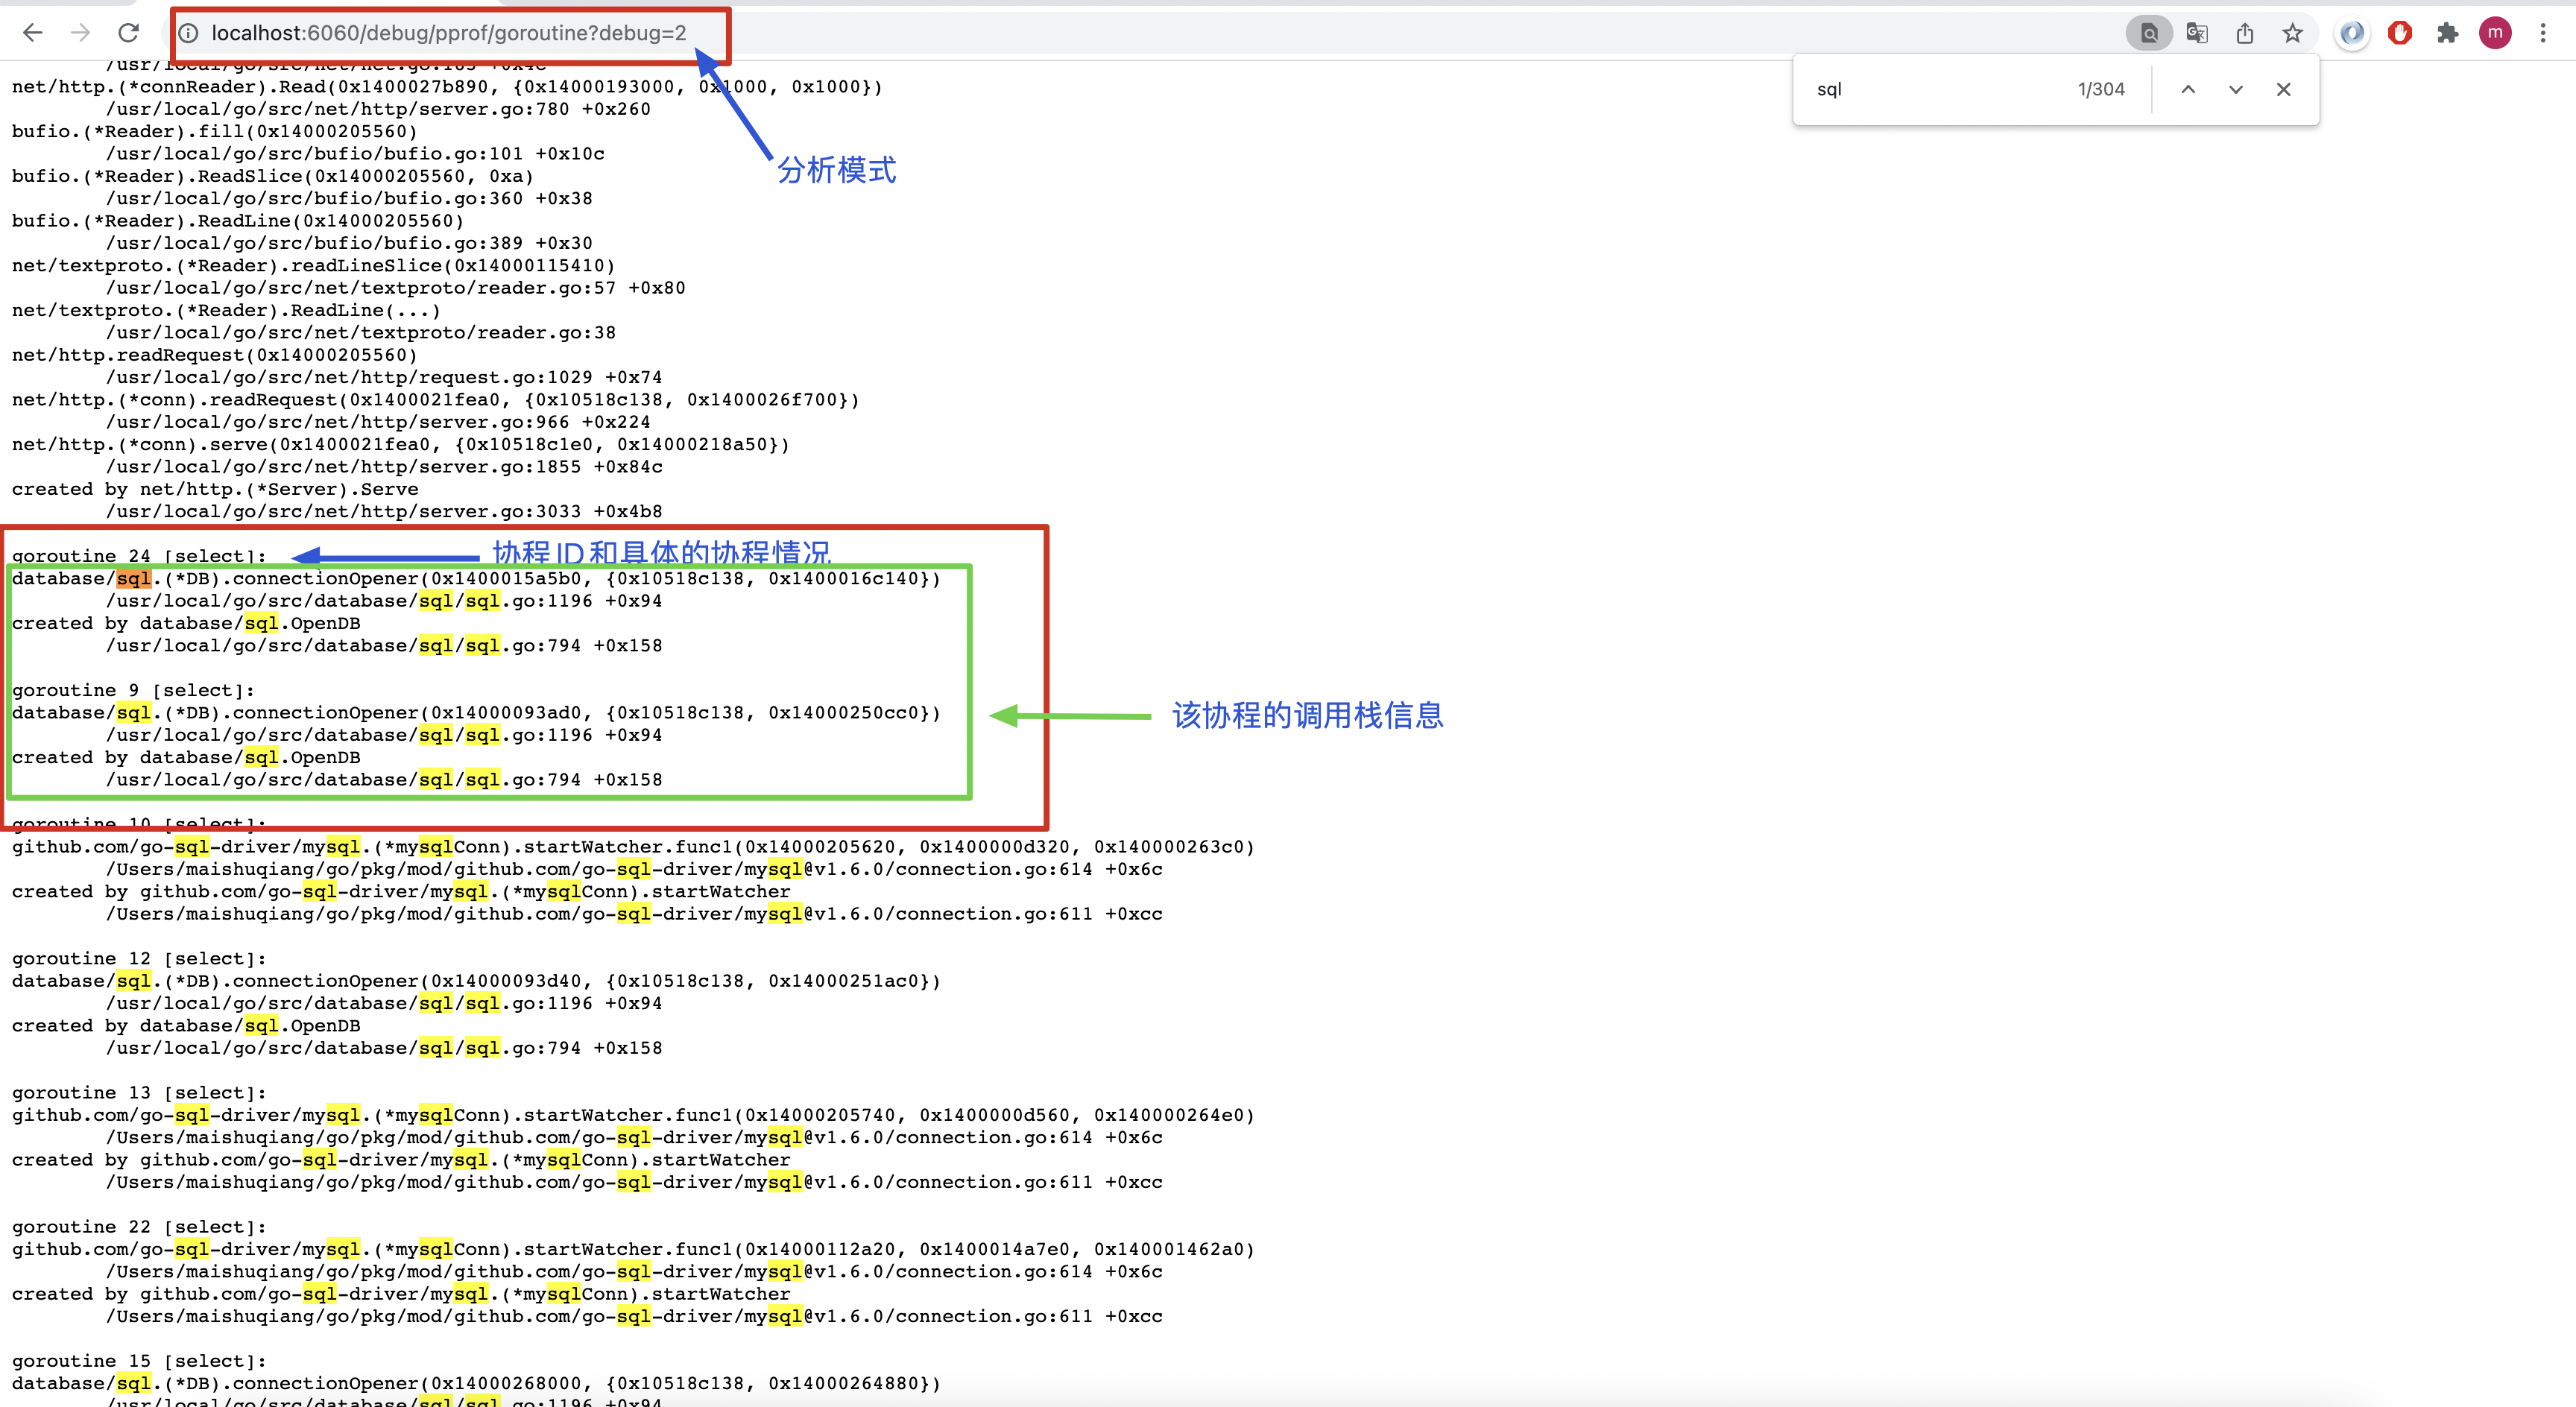
-
debug=2模式详细介绍了每一个协程的各自情况,查看到大多数协程都阻塞在了select上
我们也可以导出协程分析文件进行分析
http://localhost:6060/debug/pprof/goroutine?seconds=10
- 其中seconds可以指定采集的时间
- 采集后的分析文件我们可以通过之前介绍的命令尽心分析
go tool pprof 「分析文件」- 配合top,list,traces等命令查看协程的情况,查看协程具体泄漏在哪
go-test pprof分析
我们也可以在单元测试中进行分析采样,下面展示使用go test分析cpu的的情况
// 1 1 2 3 5 ...

const mod int = 1e9 + 7

func fib(i int) int {
    if i <= 2 {
        return 1
    }

    return (fib(i-1) + fib(i-2)) % mod
}

func Benchmark_fib(b *testing.B) {
    for i := 0; i < b.N; i++ {
        fib(30)
    }
}
-
执行命令
go test -bench=Benchmark_fib -cpuprofile=c1Profile -cpu 1
-
获取到分析文件后,我们换另一种方式查看分析文件
-
执行命令
go tool pprof -http=:6060 c1Profile
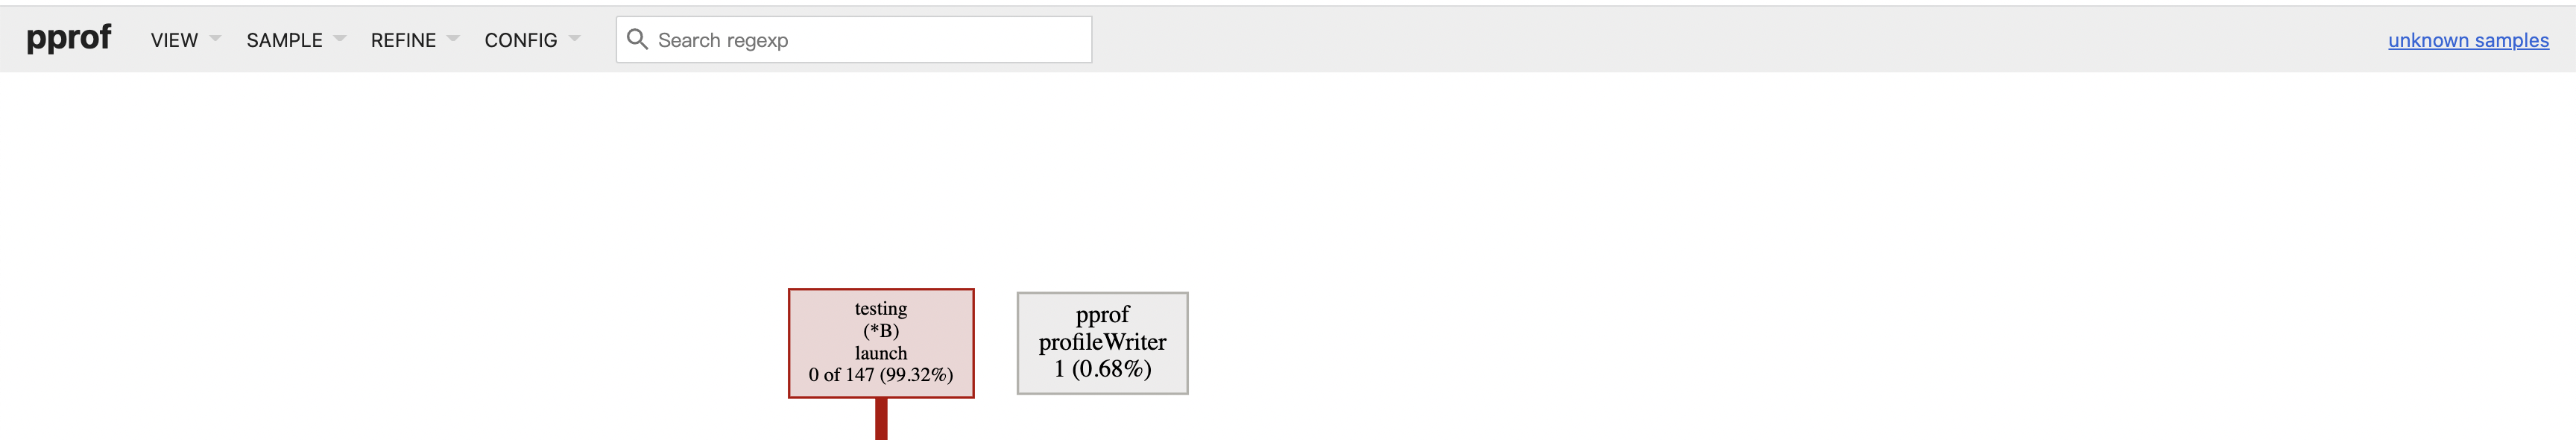
程序会打开默认浏览器,我们可以点击上面的按钮选择不同的查看模式
VIEW
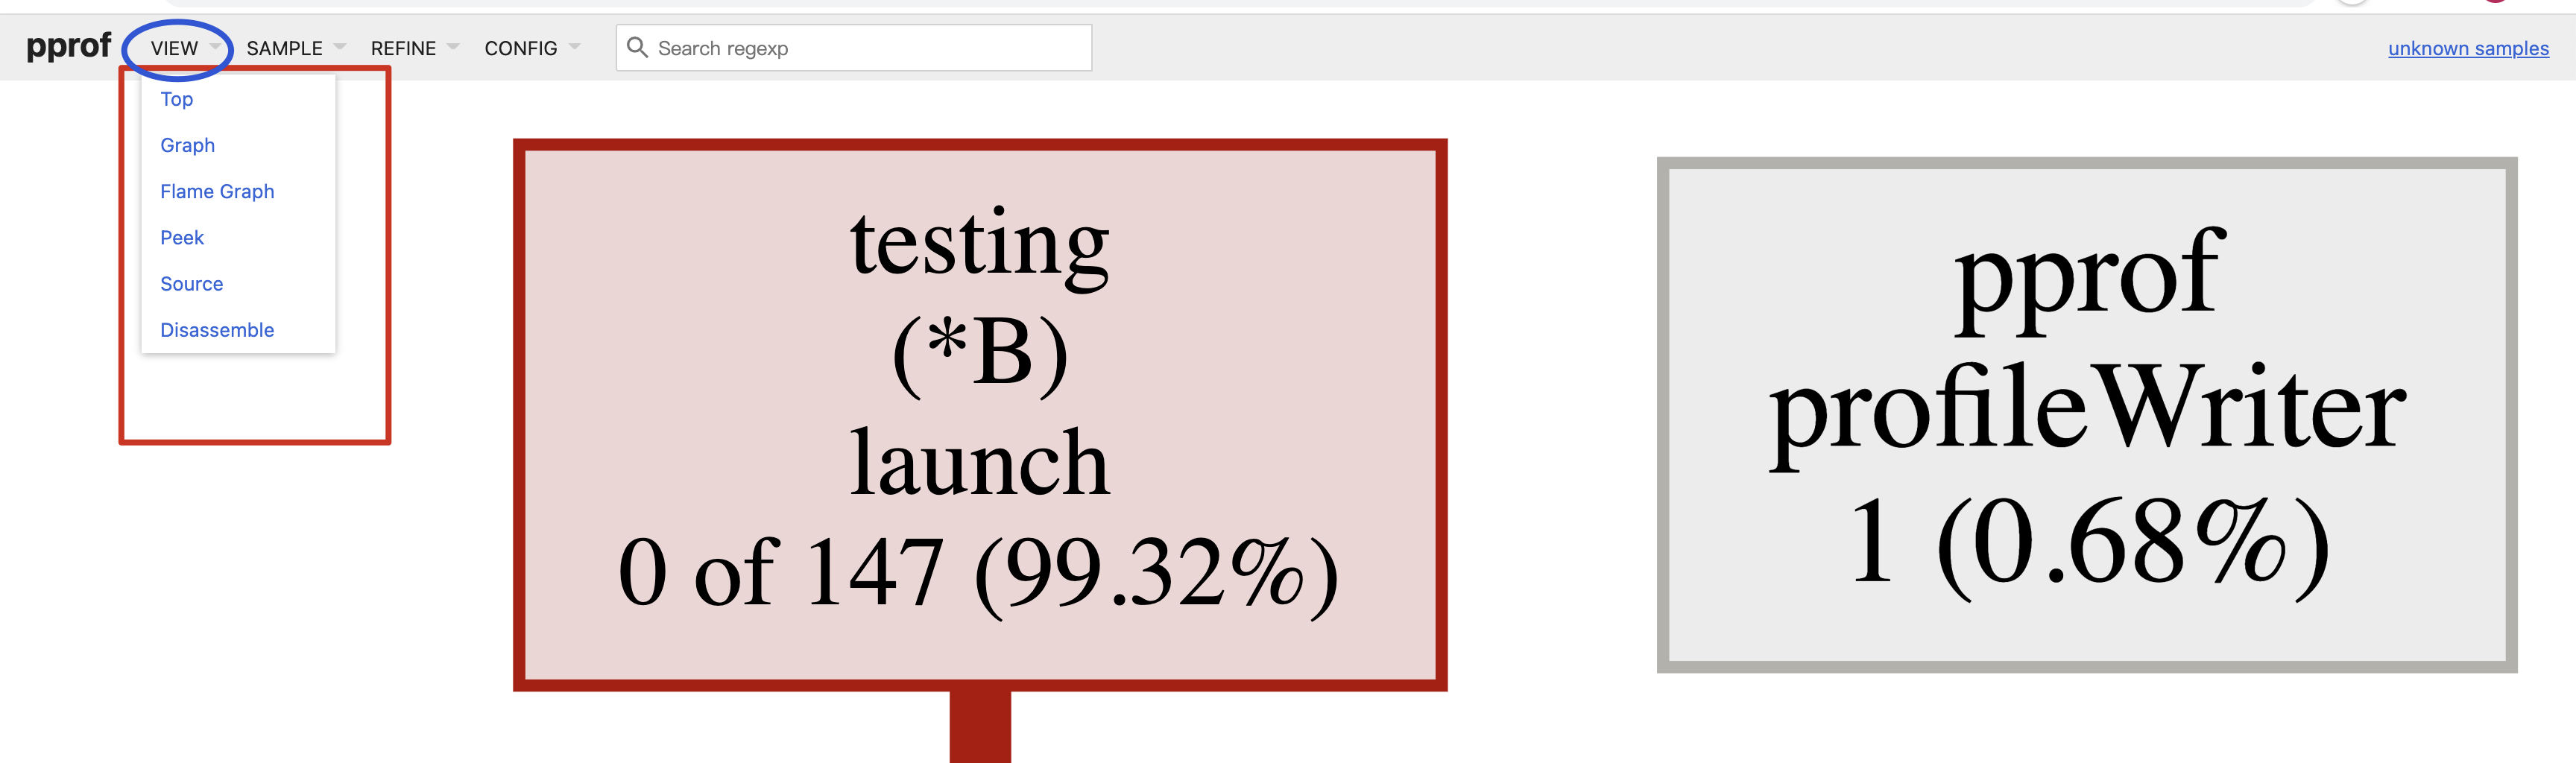
- 我们可以点击Flam Graph查看火焰图
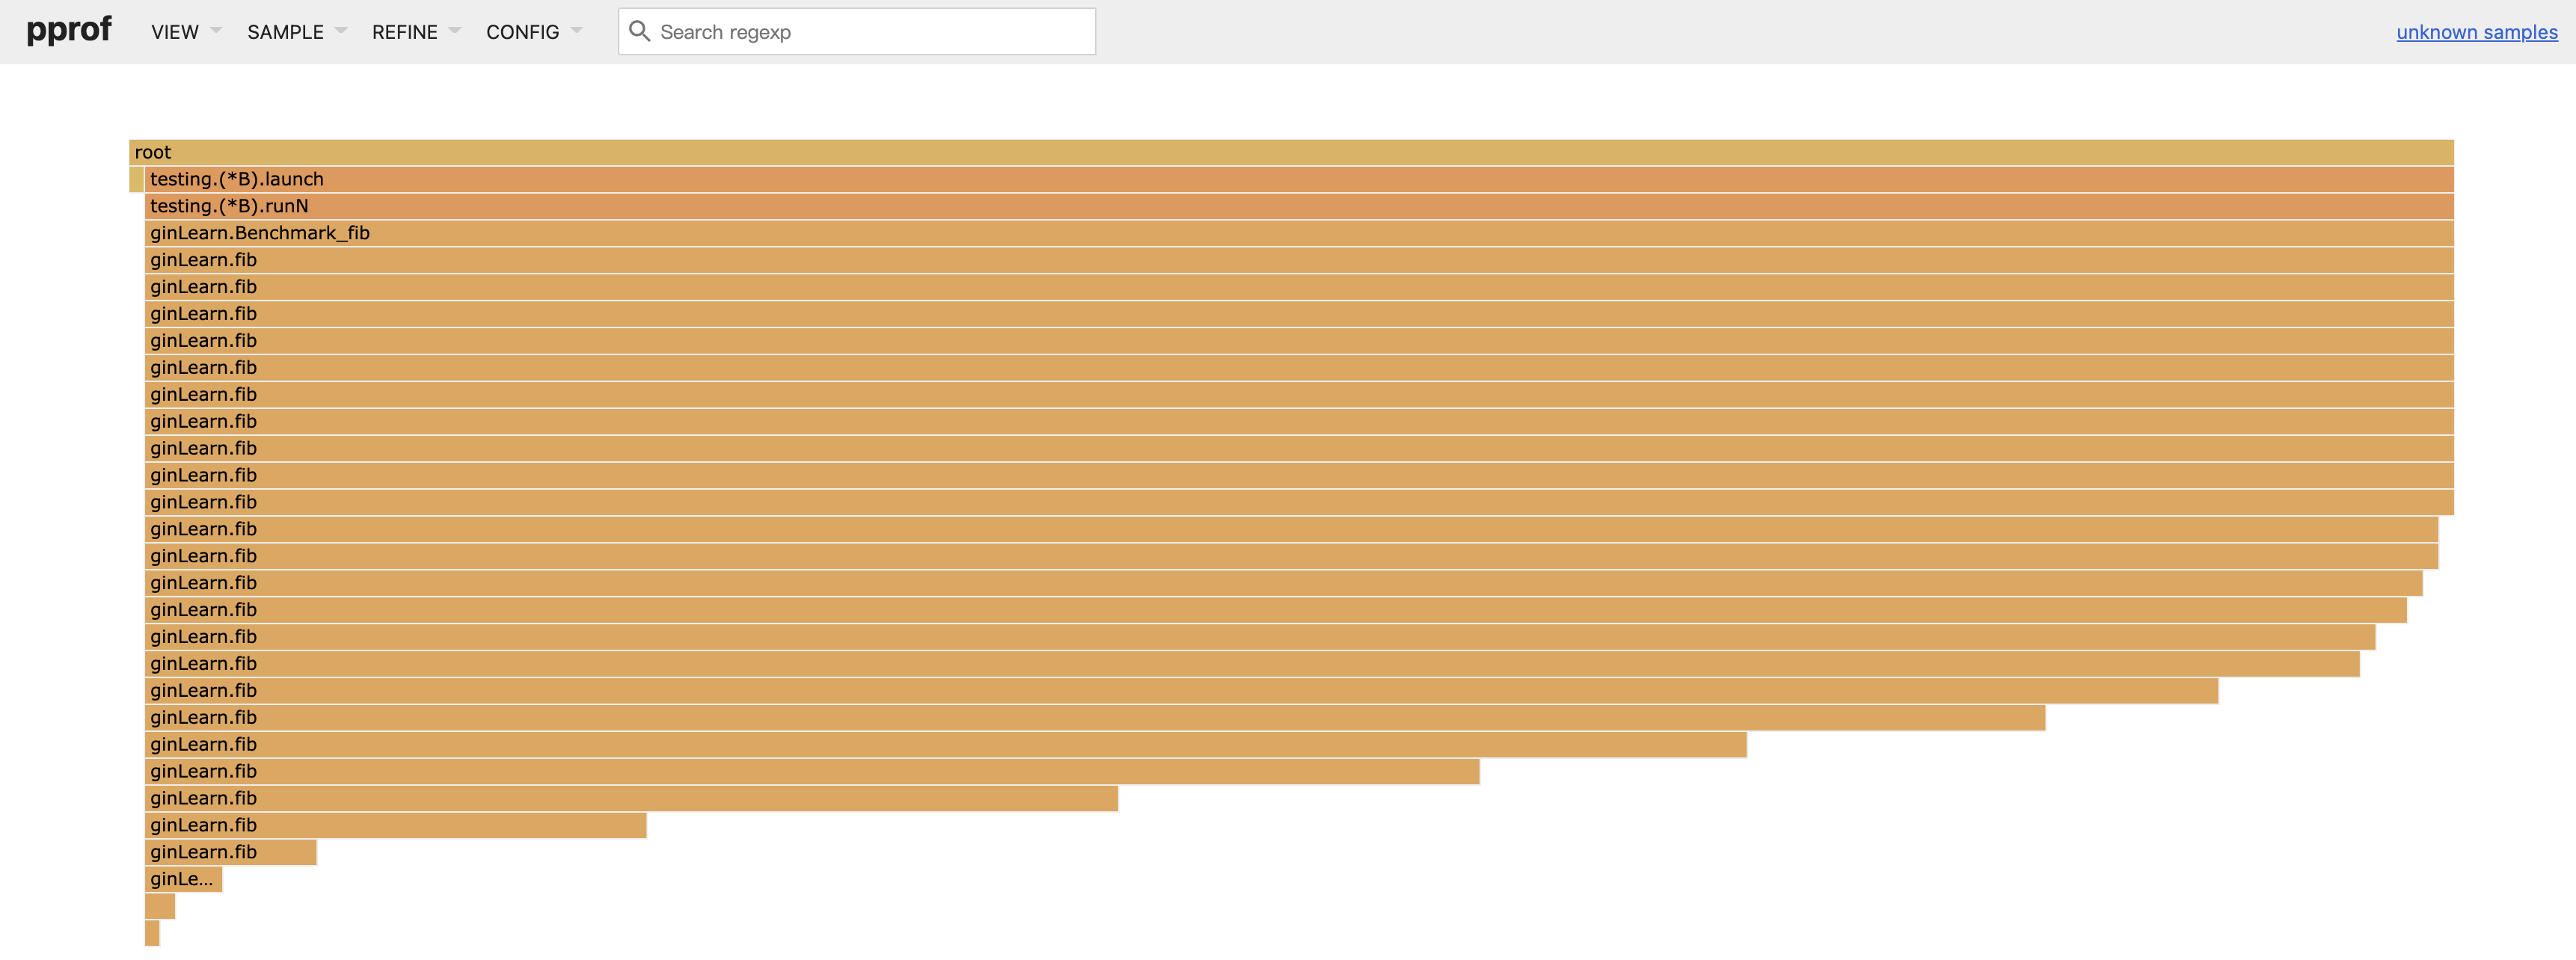
- Peek查看查看cpu占用的概述
- top查看概览,Graph以图表的方式展示
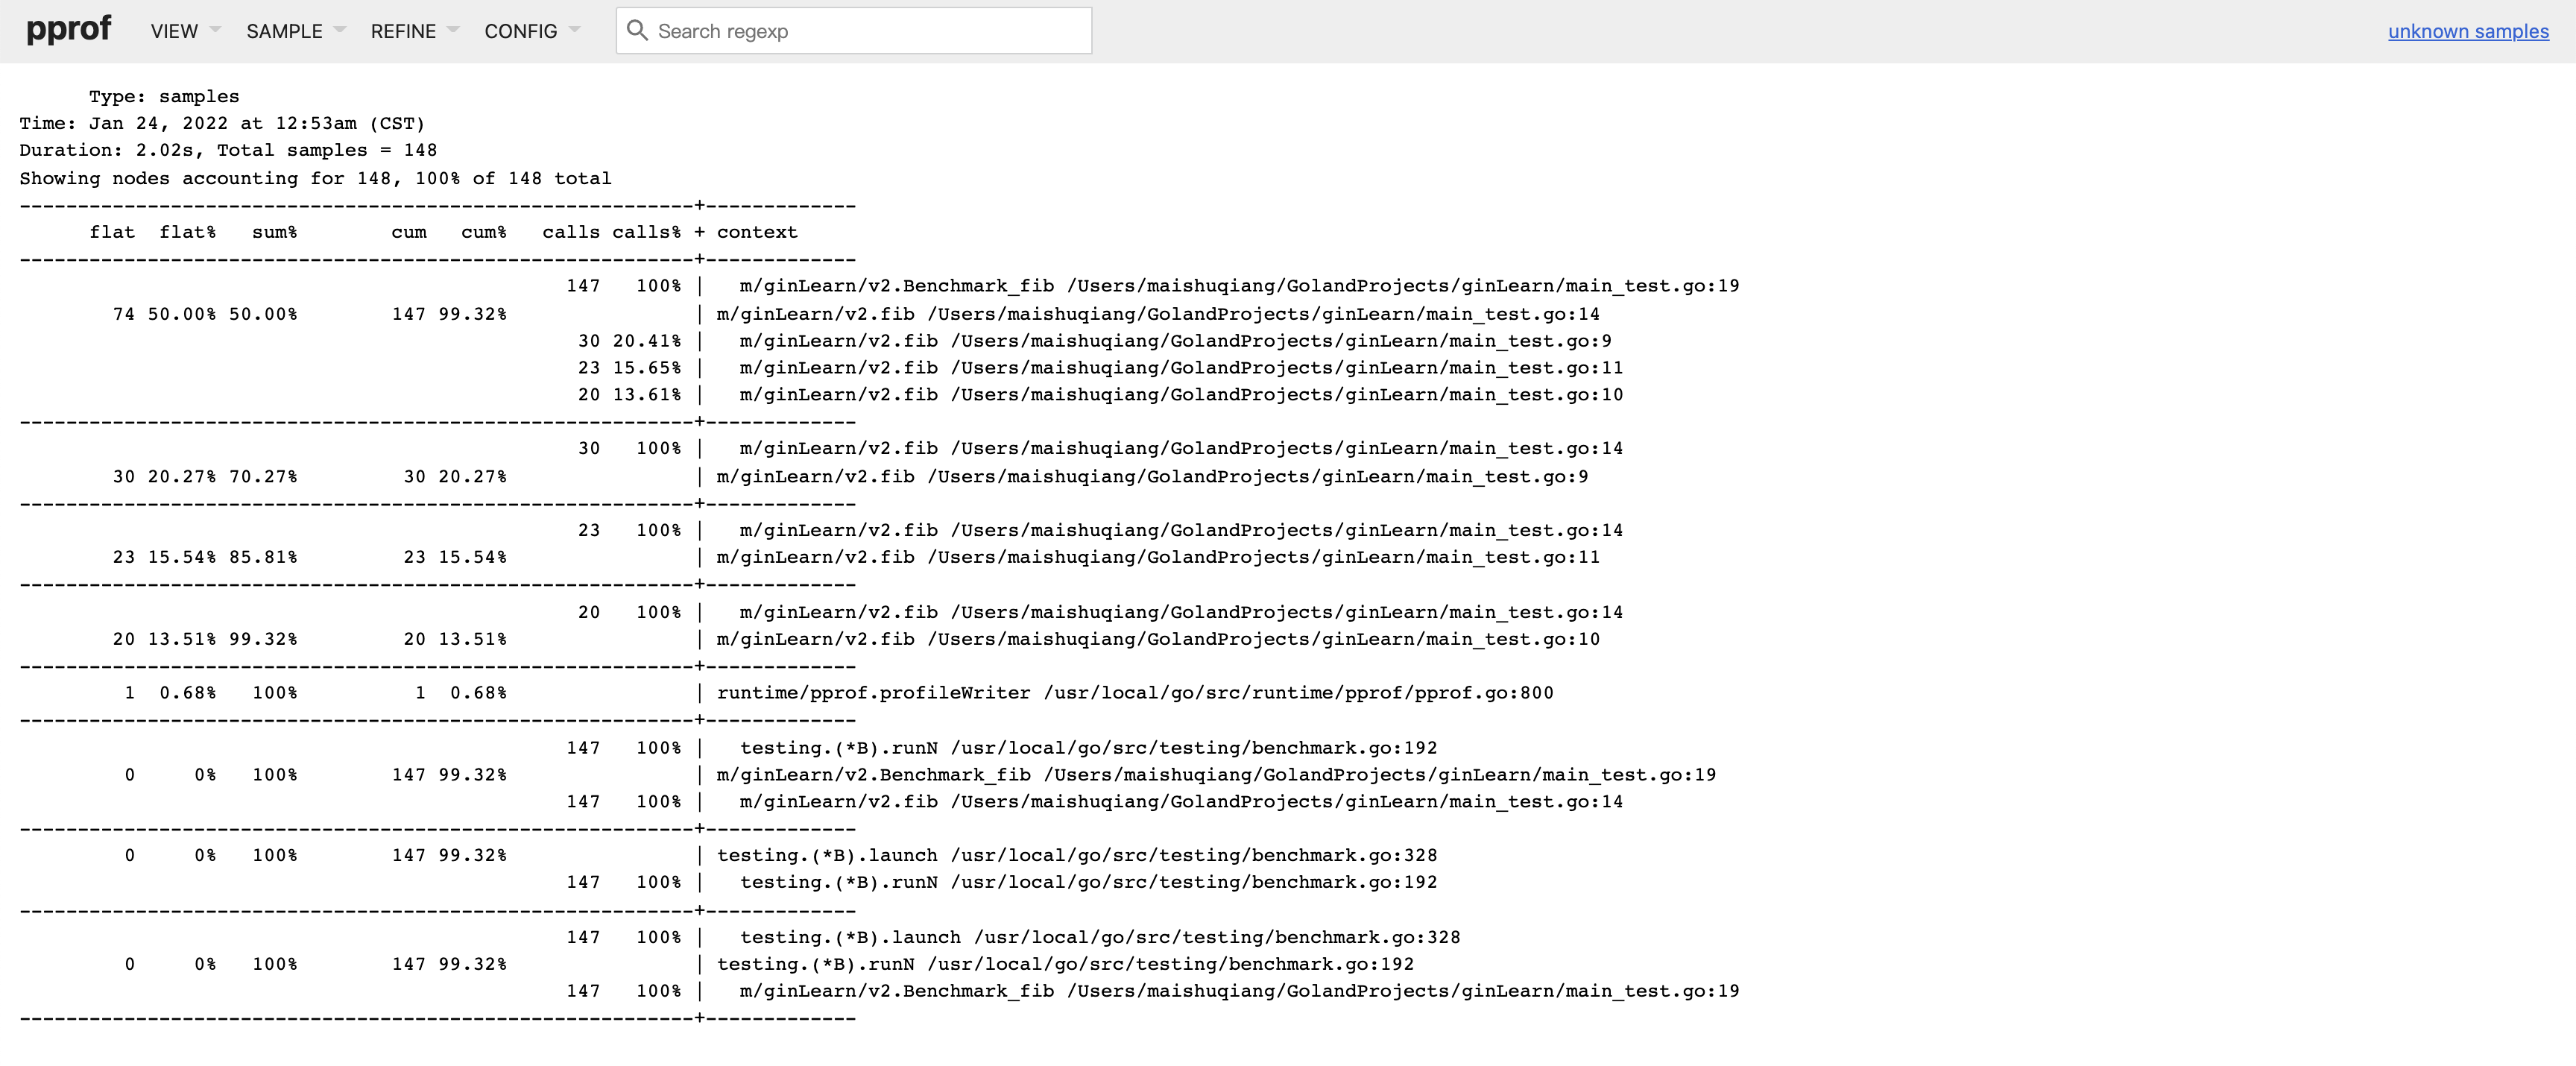
- Source查看具体的情况
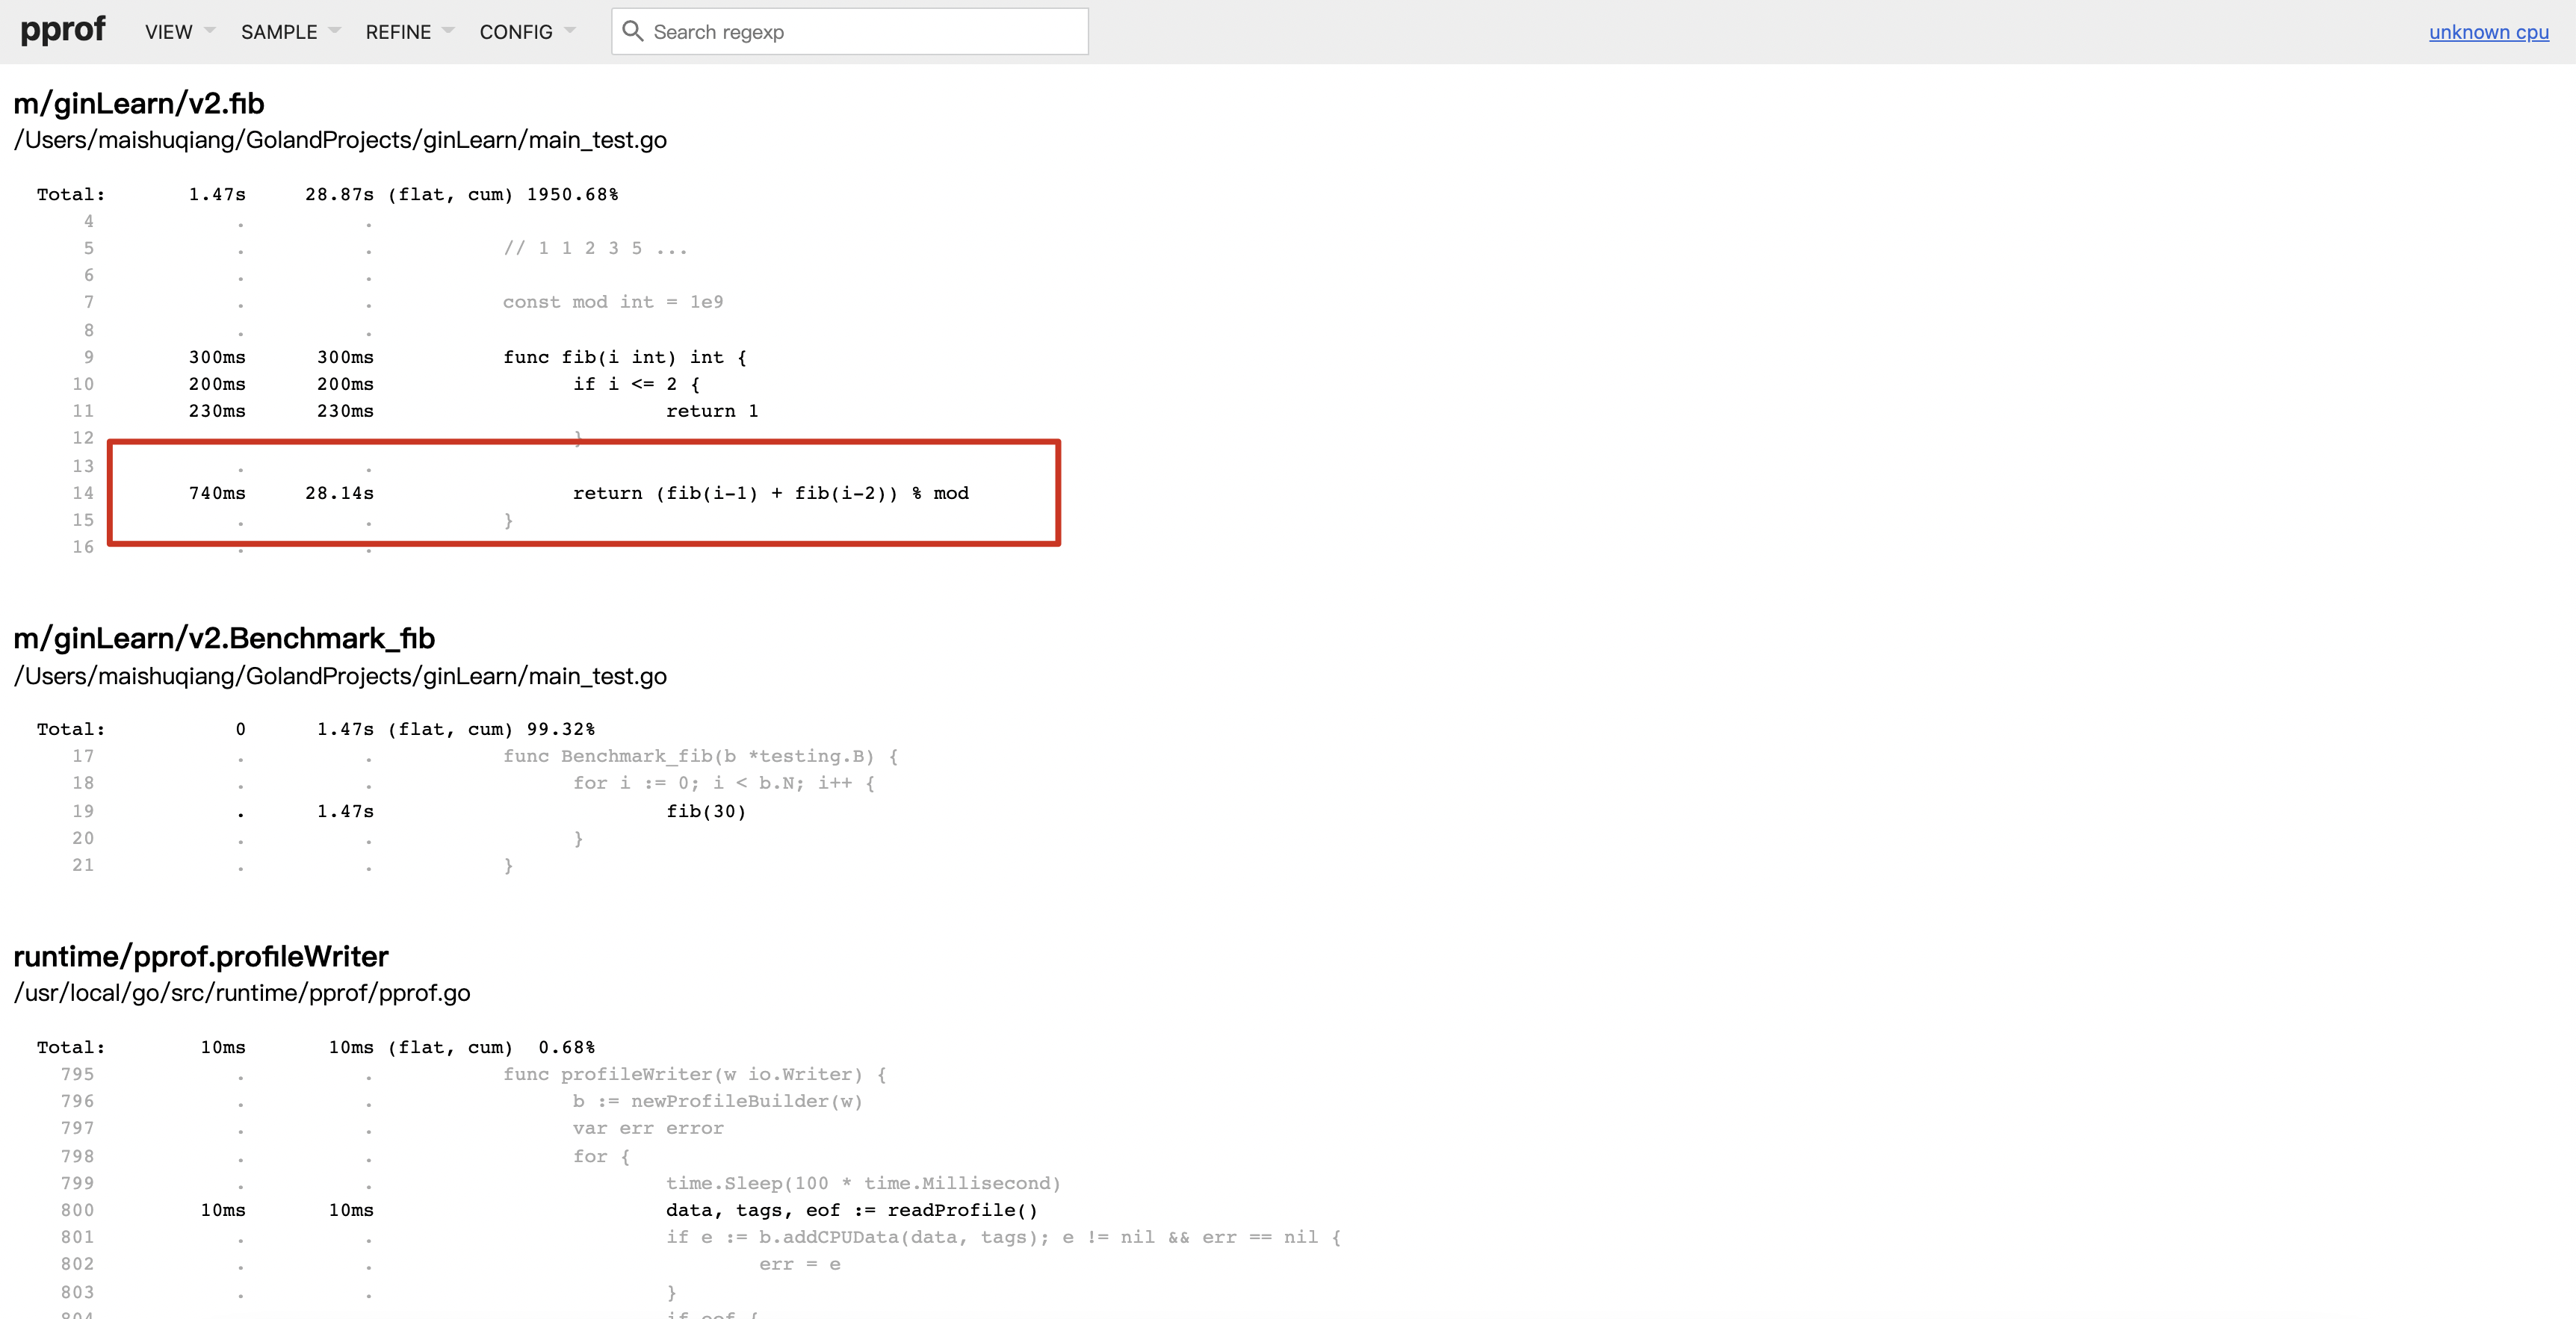
可以看到程序耗时主要集中在14行代码
pprof分析文件对比
-
上述我们介绍了3种pprof的使用方式,并介绍了不同方法采集pprof分析文件和分析样本
-
上述的3个例子给出了cpu,heap,goroutine的的采集分析介绍,但我们没有介绍如何解决上述问题,当作思考练习
-
下面我们通过pprof分析文件的对比,以其中一个demo展示优化后的分析使用
-
以最后一个cpu为例
在cpu的例子中,我们分析到了程序耗时的主要原因在于递归中,我们想办法将递归进行优化,代码如下
// 1 1 2 3 5 ...

const mod int = 1e9 + 7

func fib(n int) int {
    if n < 2 {
        return 1
    }
    pre, cur := 1, 1
    for i := 2; i <= n; i++ {
        res := (pre + cur) % mod
        pre = cur % mod
        cur = res % mod
    }
    return pre
}

func Benchmark_fib(b *testing.B) {
    for i := 0; i < b.N; i++ {
        fib(30)
    }
}
- 运行
go test -bench=Benchmark_fib -cpuprofile=c2Profile -cpu 1 - 单独分析c2Profile分析文件
- 这次使用命令行交换的形式
- 运行
go tool pprof c2Profile
(pprof) top
Showing nodes accounting for 1590ms, 100% of 1590ms total
      flat  flat%   sum%        cum   cum%
    1070ms 67.30% 67.30%     1070ms 67.30%  m/ginLearn/v2.fib
     460ms 28.93% 96.23%     1590ms   100%  m/ginLearn/v2.Benchmark_fib
      60ms  3.77%   100%       60ms  3.77%  runtime.asyncPreempt
         0     0%   100%     1590ms   100%  testing.(*B).launch
         0     0%   100%     1590ms   100%  testing.(*B).runN
(pprof) list v2.fib
Total: 1.59s
ROUTINE ======================== m/ginLearn/v2.fib in /Users/maishuqiang/GolandProjects/ginLearn/main_test.go
     1.07s      1.07s (flat, cum) 67.30% of Total
         .          .      9:func fib(n int) int {
         .          .     10: if n < 2 {
         .          .     11:  return 1
         .          .     12: }
         .          .     13: pre, cur := 1, 1
     1.07s      1.07s     14: for i := 2; i <= n; i++ {
         .          .     15:  res := (pre + cur) % mod
         .          .     16:  pre = cur % mod
         .          .     17:  cur = res % mod
         .          .     18: }
         .          .     19: return pre
(pprof)
-
单独分析c2Profile可以看到花费的时间减少了很多
-
我们可以通过对比,查看具体时间减少在哪
-
执行命令
go tool pprof -base c1Profile c2Profile -
上述命令表示以c1Profile为基准,c2Profie与c1Profile进行对比
-
也可以使用web的形式打开
-
go tool pprof -base -http=:6061 c1Profile c2Profile
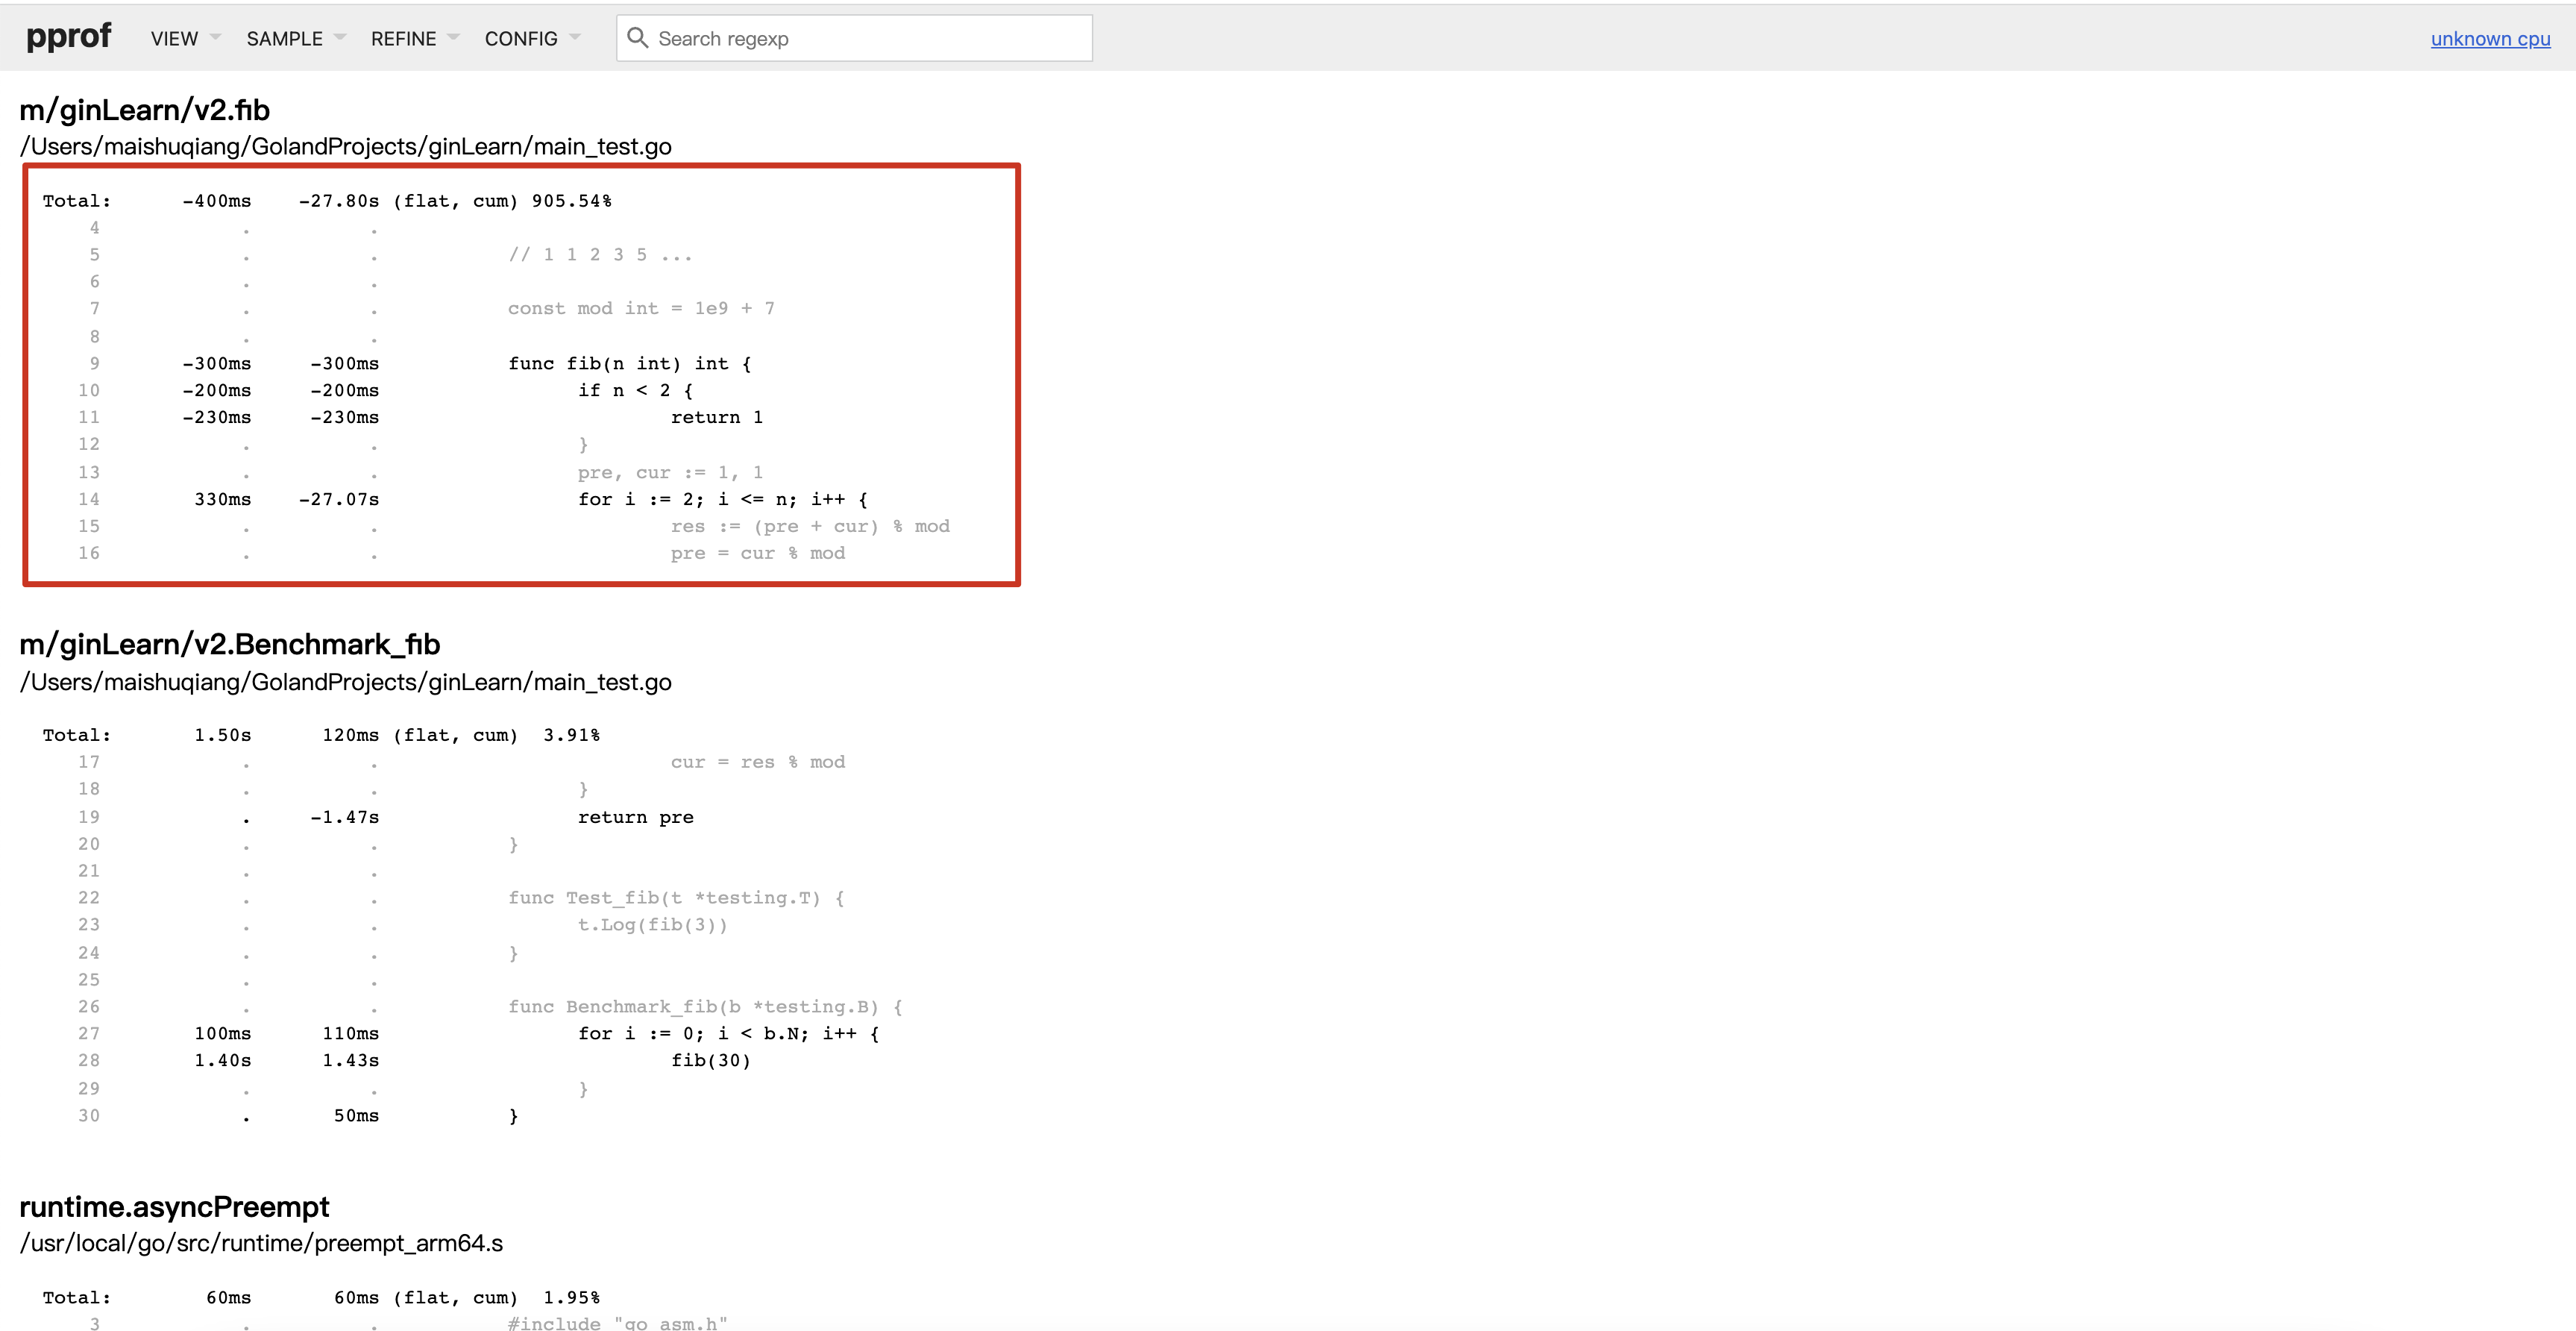
通过优化我们可以明显看到耗时的减少,以及减少在哪
-
上述我们介绍了pprof的几种使用方式,也介绍了pprof的-base对比使用
-
也留下了一些思考留给大家
-
pprof的简单介绍到此,还有很多命令没有介绍,如web命令,排序命令,tree命令等
-
相信通过了原生的pprof的使用,jarvis上的分析工具也会使用了🤓