你想让你的webpack项目构建更快吗?你想知道webpack详细的构建流程吗?看完本篇之后,你或许会有一定的收获。
前言
webpack作为前端必备的构建工具,优化项目webpack构建性能是我们一直在做的事情,那么在优化的过程中,我们会借助一些工具,来帮助我们定位性能瓶颈,并最终提高效率,本篇除了介绍一些工具应该怎么用,还从原理的角度来分析,帮助我们在使用工具的时候更能够得心应手
优化webpack项目一般从两个方面入手
- 构建耗时
- 构建产物大小
本篇主要围绕着构建耗时来讲,通过不同的工具来帮助我们打印webpack构建过程中的详细耗时,从而定位性能瓶颈
耗时打印方式
本篇主要介绍三种耗时打印方式
speed-measure-webpack-plugin插件打印loader与plugin耗时webpack.Progressplugin打印webpack各个流程处理阶段耗时stats打印各个hook阶段耗时
speed-measure-webpack-plugin获取loader与plugin耗时
安装
pnpm add speed-measure-webpack-plugin -D
使用
const SpeedMeasurePlugin = require('speed-measure-webpack-plugin')

const smp = new SpeedMeasurePlugin();

module.exports = smp.wrap({
    ...webpack配置
})
输出如下 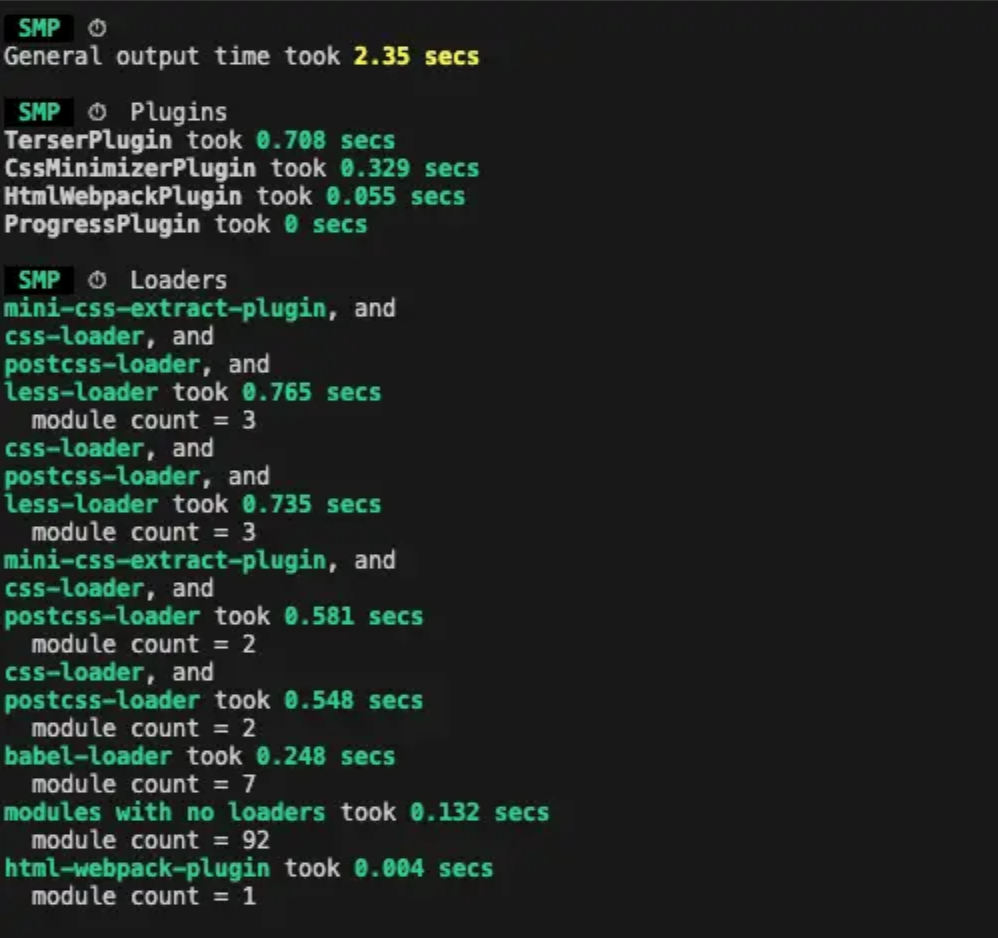
日志一般分为三部分
webpack本次构建耗时- 各个
plugin的耗时 loader链的耗时
以上面例子输出的耗时记录看
- 本地
webpack构建耗时2.35s TerserPlugin插件内注册的所有hook方法执行耗时0.708sCssMinimizerPlugin插件内注册的所有hook方法执行耗时0.329s- 经过
mini-css-extract-plugin-css-loader-postcss-loader-less-loader4个loader处理的模块有3个,总共耗时0.765s - 没有
loader处理的模块有92个,耗时0.132s
从上面的日志我们可以详细的知道,哪个plugin及哪个loader链条处理最耗时,然后找出耗时原因,并进一步进行优化
另一方面,这个耗时到底准不准,它是怎么统计出来的,我们可以通过查看源码,从源码查看耗时是怎么被统计的,mini-css-extract-plugin版本为2.7.5
耗时统计原理
webpack总时长统计
apply(compiler) {
    tap(compiler, "compile", () => {
      this.addTimeEvent("misc", "compile", "start", { watch: false });
    });
    tap(compiler, "done", () => {
      clear();
      this.addTimeEvent("misc", "compile", "end", { fillLast: true });
    });
}
从源码看,General output time took 就是 webpack compile hook => done hook的耗时,基本上与webpack构建一次的耗时一致
plugin耗时统计
精简之后的伪代码实现如下
module.exports.WrappedPlugin = class WrappedPlugin {
  constructor(plugin, pluginName, smp) {
    this._smp_plugin = plugin;
    this._smp_pluginName = pluginName;
    this._smp = smp;

    this.apply = this.apply.bind(this);

    const wp = this;
    // 代理插件,用于劫持插件方法
    return new Proxy(plugin, {
      get(target, property) {
        if (property === "apply") {
          return wp.apply;
        }
        return target[property];
      }
    });
  }

  apply(compiler) {
    // 保证每个插件apply调用的时候,传入的参数是代理的compiler参数
    return this._smp_plugin.apply(
      wrap(compiler, this._smp_pluginName, this._smp)
    );
  }
};

const wrap = (orig, pluginName, smp, addEndEvent) => {
  const proxy = new Proxy(orig, {
    get: (target, property) => {
      const raw = Reflect.get(target, property);

      // webpack4之前的插件定义方式
      if (shouldWrap && property === "plugin")
        return genPluginMethod(...).bind(proxy);

      // webpack4+插件定义方式
      if (shouldWrap && property === "hooks")
        // 劫持compiler.hooks
        return wrapHooks(...);
    },
  });
  return proxy;
};

// 代理hooks上的方法
const wrapHooks = (orig, pluginName, smp, type) => {
  const hooks = orig.hooks;

  const genProxy = method => {
    const proxy = new Proxy(hooks[method], {
      get: (target, property) => {
        const raw = Reflect.get(target, property);
      	// 劫持hooks上对应的tap、tapAsync、tapPromise方法,方便统计注册的callback代码执行时间
        if (property === "tap" && typeof raw === "function")
          return wrapTap(raw, pluginName, smp, type, method).bind(proxy);
        if (property === "tapAsync" && typeof raw === "function")
          return wrapTapAsync(raw, pluginName, smp, type, method).bind(proxy);
        if (property === "tapPromise" && typeof raw === "function")
          return wrapTapPromise(raw, pluginName, smp, type, method).bind(proxy);

        return raw;
      },
    });
    return proxy;
  };

  const wrapped = Object.keys(hooks).reduce((acc, method) => {
    acc[method] = genProxy(method);
    return acc;
  }, {});

  wrappedHooks.push({ orig: hooks, wrapped, pluginName });

  return wrapped;
};

// 具体的tap拦截方法
const wrapTap = (tap, pluginName, smp, type, method) =>
  function(id, func) {
    const timeEventName = pluginName + "/" + type + "/" + method;
    const wrappedFunc = genWrappedFunc({
      func,
      smp,
      context: this,
      timeEventName,
      pluginName,
    });
    // 实际插件内tap注册的是wrappedFunc函数
    return tap.call(this, id, wrappedFunc);
  };

const genWrappedFunc = ({
  func,
  smp,
  context,
  timeEventName,
  pluginName,
  endType,
}) => (...args) => {
  const id = idInc++;

  const addEndEvent = () =>
    smp.addTimeEvent("plugins", timeEventName, "end", {
      id,
      allowFailure: true,
    });
	// 改写了callback,所以先记录下callback调用开始的时间
  smp.addTimeEvent("plugins", timeEventName, "start", {
    id,
    name: pluginName,
  });

  const normalArgMap = a => wrap(a, pluginName, smp);
  let ret;
  if (endType === "wrapDone")
    ret = func.apply(
      context,
      args.map(a => wrap(a, pluginName, smp, addEndEvent))
    );
  else if (endType === "async") {
    const argsButLast = args.slice(0, args.length - 1);
    // 调用插件内hook真实注册的callback
    const callback = args[args.length - 1];
    ret = func.apply(
      context,
      argsButLast.map(normalArgMap).concat((...callbackArgs) => {
        // 记录下callback调用结束时间,这样加上callback调用开始的时间,久可以知道当前插件内对应的hook执行了多长时间
        addEndEvent();
        callback(...callbackArgs);
      })
    );
  } else if (endType === "promise")
    ret = func.apply(context, args.map(normalArgMap)).then(promiseArg => {
      addEndEvent();
      return promiseArg;
    });
  else ret = func.apply(context, args.map(normalArgMap));
  addEndEvent();

  return ret;
};
总结起来具体的过程就是:
- 使用
Wrappedplugin包裹传入的plugin - 然后在
Wrappedplugin内劫持plugin,并且执行plugin.apply方法的时候,劫持传入的compiler对象 - 而在劫持的
compiler对象内,又继续劫持compiler.hooks上的tap、tapPromise、tapAsync方法 - 在
tap、tapPromise、tapAsync方法内劫持传入的id与callback - 重写
callback,完成每个hook的耗时统计
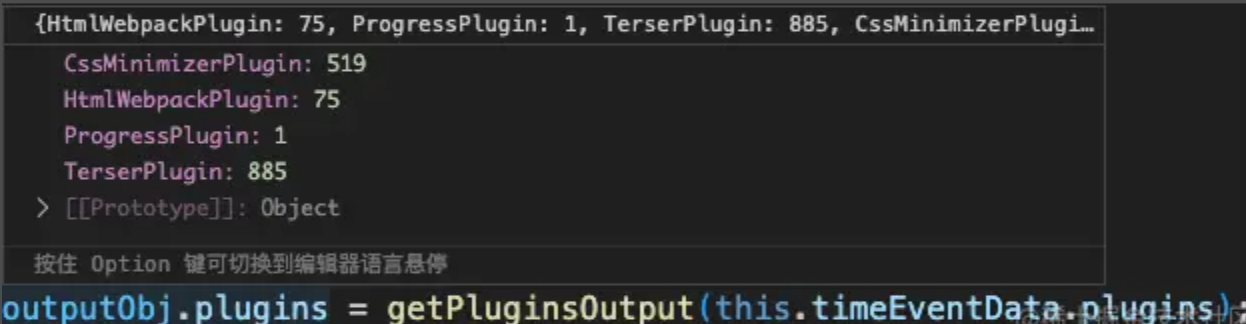
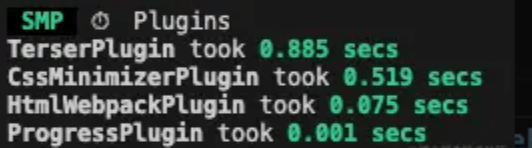
上面是关于怎么计算插件的耗时,最终输出的时间则统计的是每一个插件内,所有hook的耗时
outputObj.plugins = getPluginsOutput(this.timeEventData.plugins);
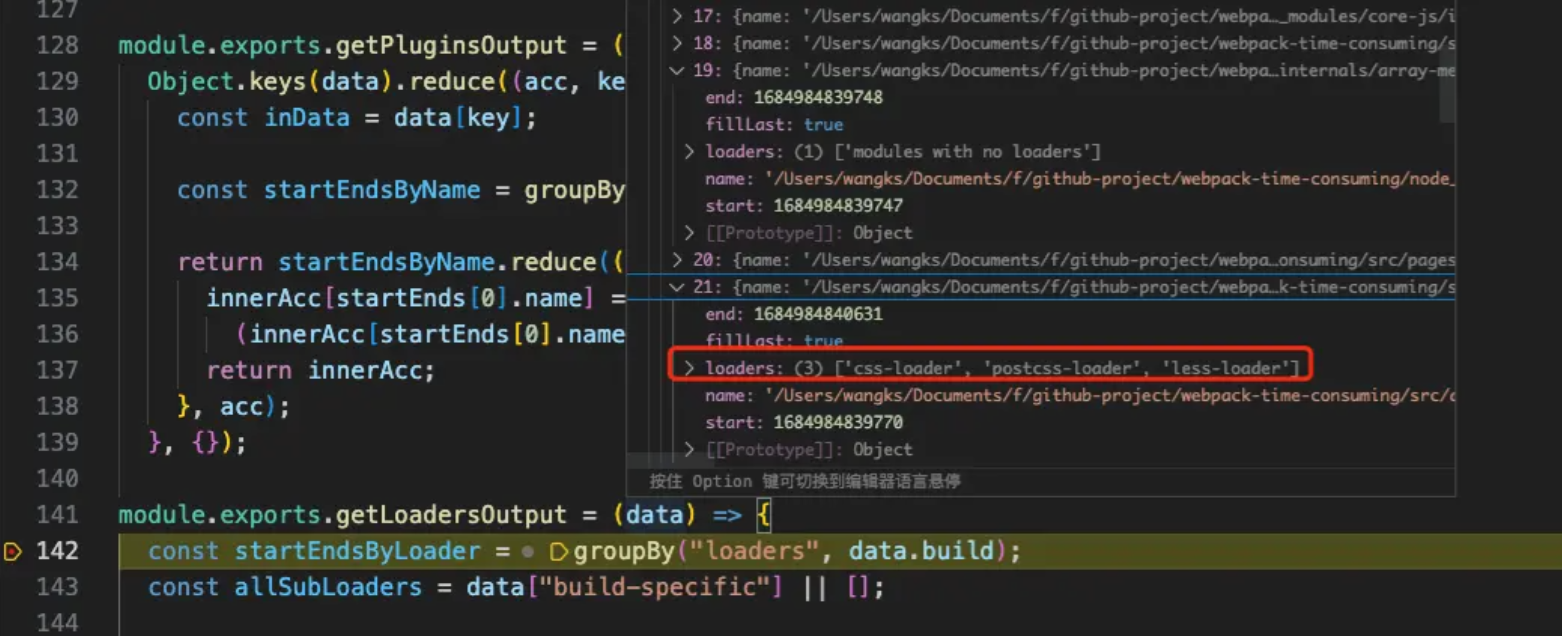
module.exports.getPluginsOutput = (data) =>
Object.keys(data).reduce((acc, key) => {
const inData = data[key];
const startEndsByName = groupBy("name", inData);
return startEndsByName.reduce((innerAcc, startEnds) => {
innerAcc[startEnds[0].name] =
(innerAcc[startEnds[0].name] || 0) + getTotalActiveTime(startEnds);
return innerAcc;
}, acc);
}, {});
这里的data结构如下所示,记录每次hook耗时 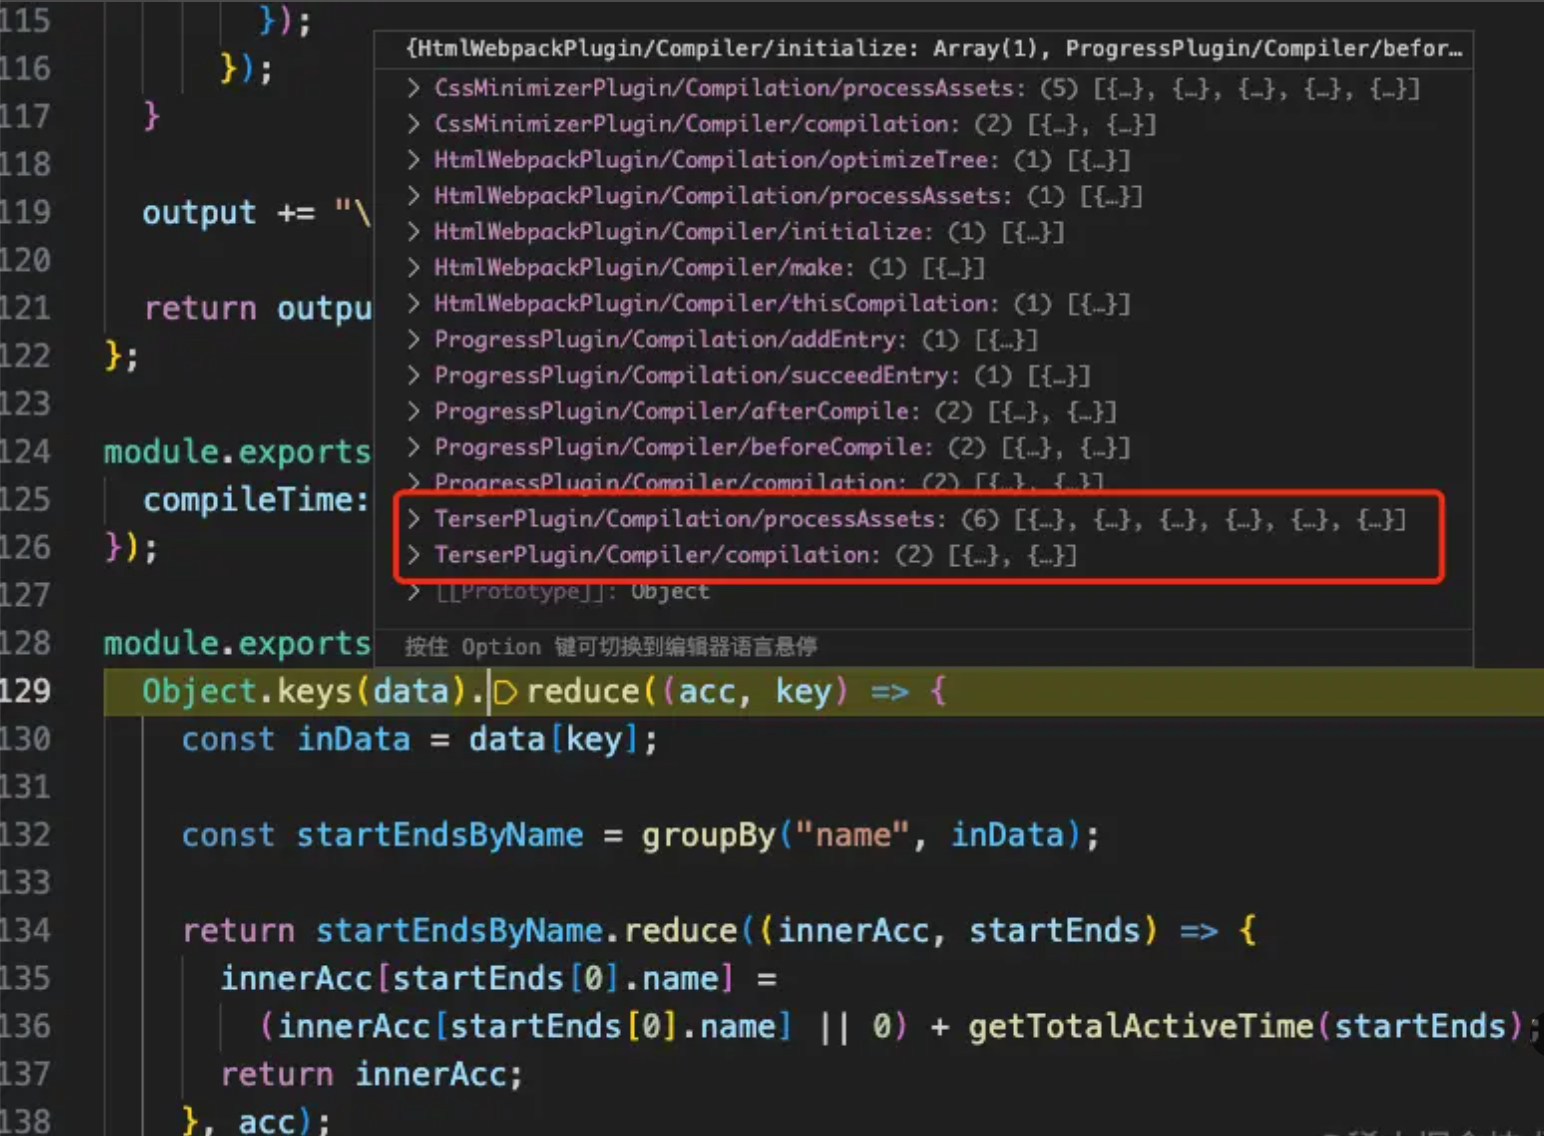
loader链耗时统计
源码如下所示
tap(compilation, "build-module", (module) => {
  // 获取模块的userRequest
  const name = getModuleName(module);
  if (name) {
    this.addTimeEvent("loaders", "build", "start", {
      name,
      fillLast: true,
      loaders: getLoaderNames(module.loaders), //获取处理当前module的loaders数组,用于最终的分组统计与展示
    });
  }
});

tap(compilation, "succeed-module", (module) => {
  const name = getModuleName(module);
  if (name) {
    this.addTimeEvent("loaders", "build", "end", {
      name,
      fillLast: true,
    });
  }
});
总结起来就是
- 监听
compilation.build-module,然后在该hook内添加start记录,build-module在module实例创建之前调用,此时module还未被loader处理 - 监听
compilation.succeed-module,然后在该hook内添加end记录,succeed-module调用时,此时module实例已经创建,且module经过了loader的处理,当然这里也包括了一点webpack内置逻辑的时间,但是问题不大 - 最后在根据
loades数组来进行分组,将loaders数组内的值完全一样的分为一组
上面是关于怎么计算loader的耗时,最终输出的时间是相同loader链模块的累计耗时,源码如下所示
module.exports.getLoadersOutput = (data) => {
const startEndsByLoader = groupBy("loaders", data.build);
const allSubLoaders = data["build-specific"] || [];
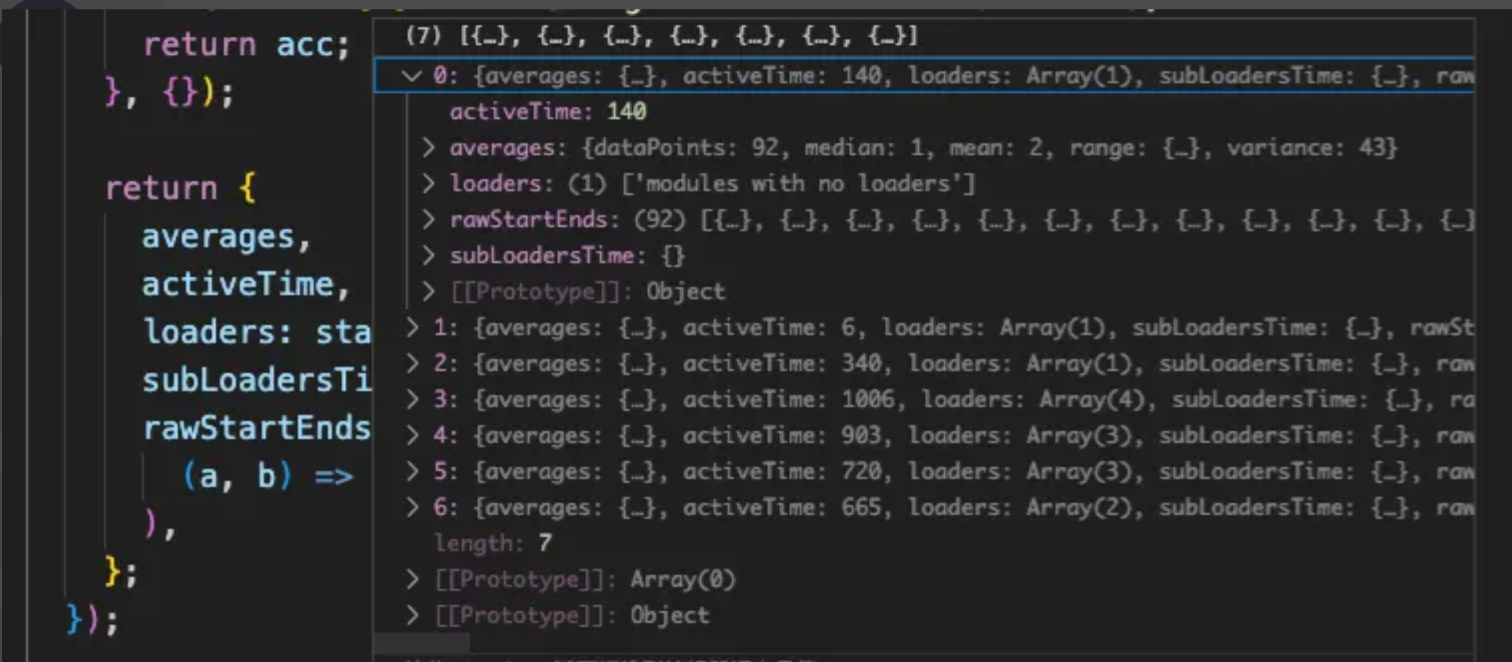
const buildData = startEndsByLoader.map((startEnds) => {
const averages = getAverages(startEnds);
const activeTime = getTotalActiveTime(startEnds);
const subLoaders = groupBy(
"loader",
allSubLoaders.filter((l) => startEnds.find((x) => x.name === l.name))
);
const subLoadersActiveTime = subLoaders.reduce((acc, loaders) => {
acc[loaders[0].loader] = getTotalActiveTime(loaders);
return acc;
}, {});
return {
averages,
activeTime,
loaders: startEnds[0].loaders,
subLoadersTime: subLoadersActiveTime,
rawStartEnds: startEnds.sort(
(a, b) => b.end - b.start - (a.end - a.start)
),
};
});
return { build: buildData };
};
注意当loaders数组为空的时候,也就是说当前module是不需要经过loader处理的话,会统计到modules with no loaders的分组,一般一些loader的辅助模块会被划分到这个分组,比如style-loader提供的一些辅助模块,如下所示
import API from "!../node_modules/style-loader/dist/runtime/injectStylesIntoStyleTag.js";
import domAPI from "!../node_modules/style-loader/dist/runtime/styleDomAPI.js";
这种禁用了normal-loader与pre-loader的辅助js文件
webpack.Progressplugin打印流程耗时
通过speed-measure-webpack-plugin插件我们已经可以知道我们在webpack.config.js内配置的loader与plugin执行的具体时间了,但是有没有更详细的统计呢?包括webpack每个阶段执行的时候及内置的一些插件执行的时间
其实webpack.Progressplugin正好提供了这些耗时统计
使用
配置webpack.Progressplugin,更多内容可以参考文档
module.exports = {
  plugins: [
    new webpack.ProgressPlugin({
      profile: true
    }),
  ],
}
需要关注的是profile这个参数,当profile为false时,只会输出构建的进度,不会输出webpack阶段耗时与内置插件的一些耗时,为了知道这些具体的耗时,需要将profile设置为true,具体输出如下所示
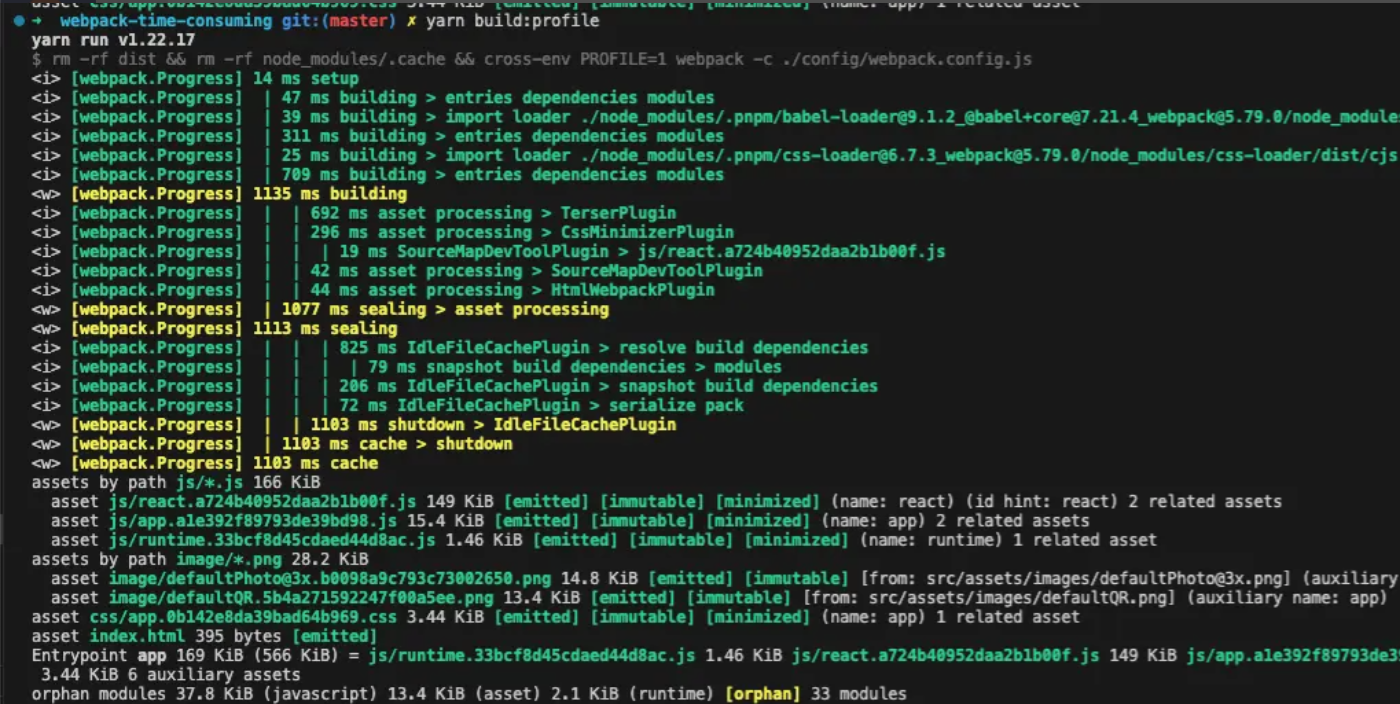 从上图可以看到输出setup也就是
webpack初始化阶段的耗时14ms,构建make阶段的一个耗时1135ms,那么其实还是有部分耗时没有输出,原因是什么呢?看Progressplugin源码,webpack版本为5.79.0
const createDefaultHandler = (profile, logger) => {

  const defaultHandler = (percentage, msg, ...args) => {
    if (profile) {
      for (let i = len; i >= 0; i--) {

        if (lastStateItem) {
          if (stateItem !== lastStateItem.value) {
            const diff = now - lastStateItem.time;
            if (lastStateItem.value) {
              let reportState = lastStateItem.value;
              if (i > 0) {
                reportState = lastStateInfo[i - 1].value + " > " + reportState;
              }
              const stateMsg = `${" | ".repeat(i)}${diff} ms ${reportState}`;
              const d = diff;
              // This depends on timing so we ignore it for coverage
              /* istanbul ignore next */
              {
                if (d > 10000) {
                  logger.error(stateMsg);
                } else if (d > 1000) {
                  logger.warn(stateMsg);
                } else if (d > 10) {
                  logger.info(stateMsg);
                } else if (d > 5) {
                  logger.log(stateMsg);
                } else {
                  logger.debug(stateMsg);
                }
              }
            }
          }
        } else {
          lastStateInfo[i] = {
            value: stateItem,
            time: now
          };
        }
      }
    }
    logger.status(`${Math.floor(percentage * 100)}%`, msg, ...args);
    if (percentage === 1 || (!msg && args.length === 0)) logger.status();
  };

  return defaultHandler;
};
从代码中可以看出来,Progressplugin插件内置的handler,当插件执行的时间或者hook执行的时间小于5ms时,会调用logger.log or logger.debug输出stateMsg,但实际上没有输出,原因是什么呢?
原理
原因就是webpack这里的logger,是由compiler.getInfrastructureLogger("webpack.Progress")创建而成,而compiler.getInfrastructureLogger方法代码如下所示
const { Logger } = require("./logging/Logger");

getInfrastructureLogger(name) {
    return new Logger(
            (type, args) => {}
    );
}
class WebpackLogger {
  constructor(log, getChildLogger) {
    this[LOG_SYMBOL] = log;
    this.getChildLogger = getChildLogger;
  }

  error(...args) {
    this[LOG_SYMBOL](LogType.error, args);
  }

  warn(...args) {
    this[LOG_SYMBOL](LogType.warn, args);
  }

  info(...args) {
    this[LOG_SYMBOL](LogType.info, args);
  }

  log(...args) {
    this[LOG_SYMBOL](LogType.log, args);
  }

  debug(...args) {
    this[LOG_SYMBOL](LogType.debug, args);
  }

}

exports.Logger = WebpackLogger;
const createConsoleLogger = require("../logging/createConsoleLogger");

class NodeEnvironmentPlugin {
  apply(compiler) {
    const { infrastructureLogging } = this.options;
    compiler.infrastructureLogger = createConsoleLogger({
      level: infrastructureLogging.level || "info",
      debug: infrastructureLogging.debug || false,
      console:
        infrastructureLogging.console ||
        nodeConsole({
          colors: infrastructureLogging.colors,
          appendOnly: infrastructureLogging.appendOnly,
          stream: infrastructureLogging.stream
        })
    });
  }
}

module.exports = NodeEnvironmentPlugin;
const LogLevel = {
	none: 6,
	false: 6,
	error: 5,
	warn: 4,
	info: 3,
	log: 2,
	true: 2,
	verbose: 1
};

module.exports = ({ level = "info", debug = false, console }) => {
    const debugFilters =
            typeof debug === "boolean"
                    ? [() => debug]
                    : /** @type {FilterItemTypes[]} */ ([])
                                    .concat(debug)
                                    .map(filterToFunction);
    /** @type {number} */
    const loglevel = LogLevel[`${level}`] || 0;

    const logger = (name, type, args) => {
        const debug = debugFilters.some(f => f(name));
        switch (type) {
            case LogType.debug:
                    if (!debug) return;
                    if (typeof console.debug === "function") {
                        console.debug(...labeledArgs());
                    } else {
                        console.log(...labeledArgs());
                    }
                    break;
            case LogType.log:
                    if (!debug && loglevel > LogLevel.log) return;
                    console.log(...labeledArgs());
                    break;
            case LogType.info:
                    if (!debug && loglevel > LogLevel.info) return;
                    console.info(...labeledArgs());
                    break;
            case LogType.warn:
                    if (!debug && loglevel > LogLevel.warn) return;
                    console.warn(...labeledArgs());
                    break;
            case LogType.error:
                    if (!debug && loglevel > LogLevel.error) return;
                    console.error(...labeledArgs());
                    break;
            }
            default:
                    throw new Error(`Unexpected LogType ${type}`);
        }
    };
    return logger;
}
上面的代码串起来就是
- 在
webpack内置NodeEnvironmentplugin插件内调用createConsoleLogger创建logger方法,并赋值给compiler.infrastructureLogger,logger方法包含log、debug、time、info、warn等方法 createConsoleLogger内的logger方法要调用最终的console[method]需要满足!debug && loglevel > LogLevel.warn的条件,也就是说debug要为true、level要小于对应的LogLevel才能够展示对用的loggetInfrastructureLogger方法返回的是new Logger实例,而logger实例内调用的log、info等方法实际上调用的又是new Logger传入的log、所以最终调用的也就是this.infrastructureLogger,也就是createConsoleLogger内的logger上的方法
在回到Progressplugin这个插件上来,因为调用的是compiler.getInfrastructureLogger("webpack.Progress"),所以实际上调用的是createConsoleLogger内的logger上对应的方法,而createConsoleLogger传入的默认值为info,所以当logger.debug or logger.log调用时,因为满足if (!debug) return; or if (!debug && loglevel > LogLevel.log) (3>2);使用logger.debug or logger.log不会输出内容
解决方法,配置infrastructureLogging的level等级为verbose,debug设置为true,如下所示
module.exports = {
  infrastructureLogging: {
    level: 'verbose',
    debug: true
  },
}
调整后的输出如下所示 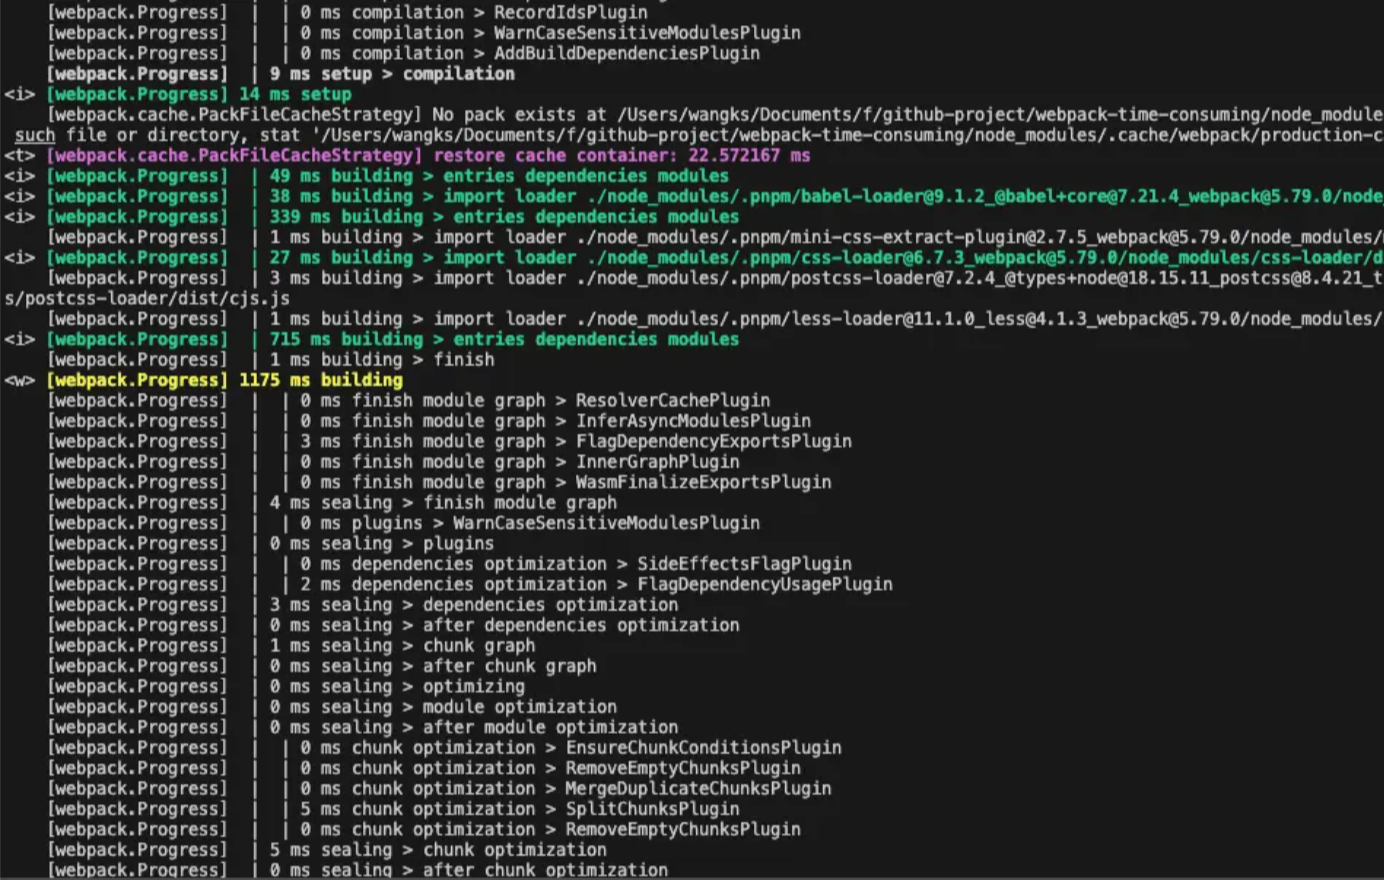 就能够详细的看到
webpack每个阶段或者一些重要过程的耗时
从这里可以进一步优化webpack构建耗时
通过上面的源码,我们知道了compiler.getInfrastructureLogger("webpack.Progress")可以获取到logger实例,同时由infrastructureLogging参数进行控制,更多参数可以参考文档,同时我们自己在写webpack插件的时候可以直接获取webpack内置的logger实例,而不需要单独写一套logger
stats打印hook阶段耗时
通过webpack.Progressplugin插件已经可以看到webpack每个阶段的耗时,但是当我只想了解一些关键的hook or 过程耗时,可以直接输出webpack内置的耗时埋点,比如make hook耗时等,具体的webpack内置耗时埋点如下所示 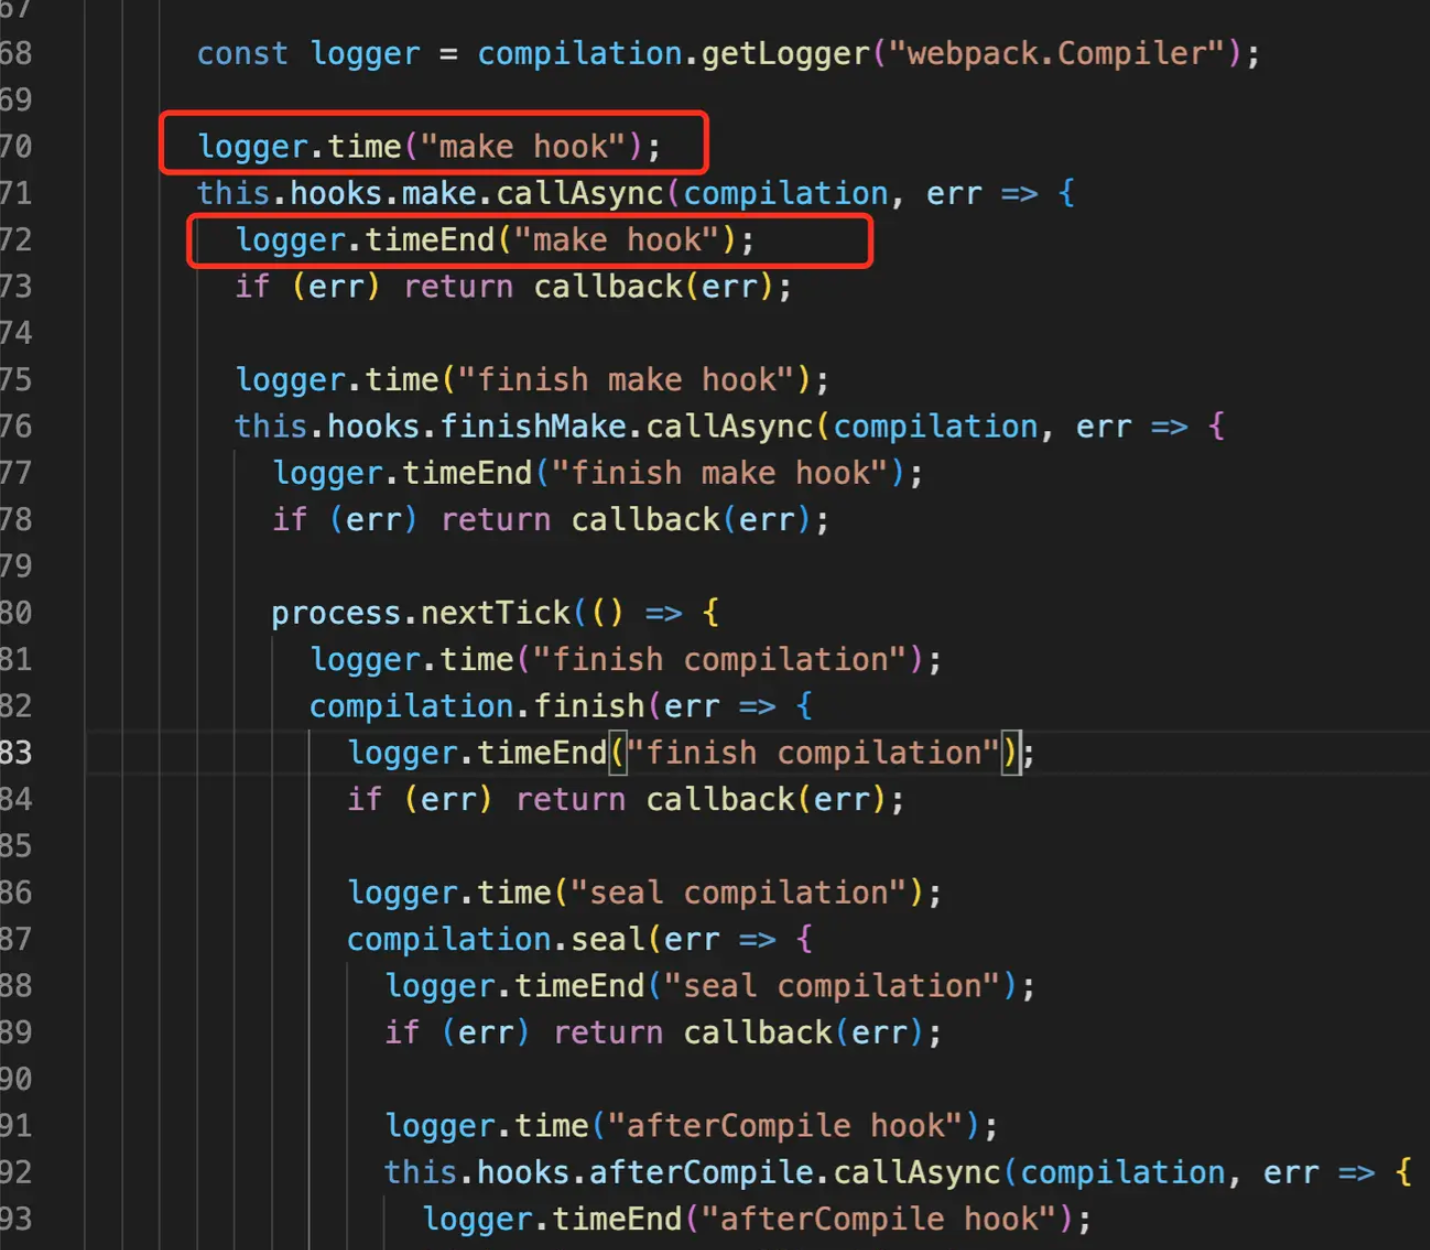
那么怎么才能够输出webpack这些内置的耗时埋点呢?
使用
这就需要stats参数,如下所示
stats: {
  logging: 'verbose',
},
配置之后webpack输出如下所示 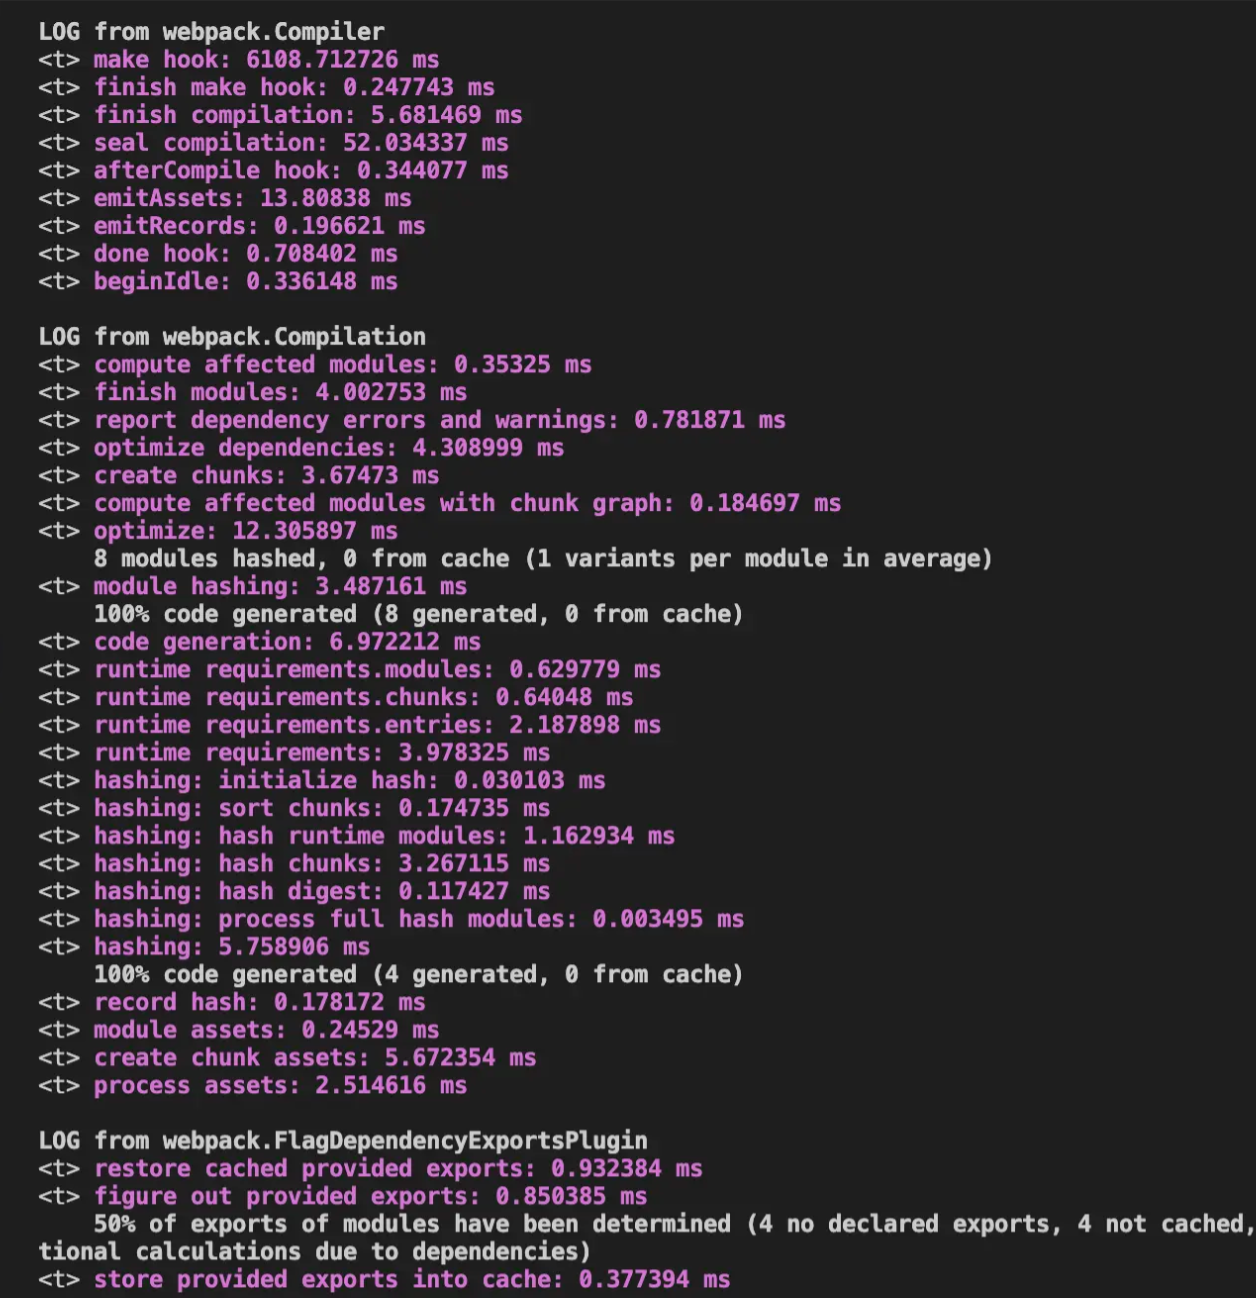
那么这里为什么需要配置stats.logging参数,而不是上一节看到的infrastructureLogging.level参数呢?原因还是需要查看compilation.getLogger(‘webpack.compiler’)获取到的是怎么logger方法是来自哪里
原理
const logger = compilation.getLogger("webpack.Compiler");

logger.time("make hook");
this.hooks.make.callAsync(compilation, err => {
  logger.timeEnd("make hook");
  if (err) return callback(err);

  logger.time("finish make hook");
	...
});
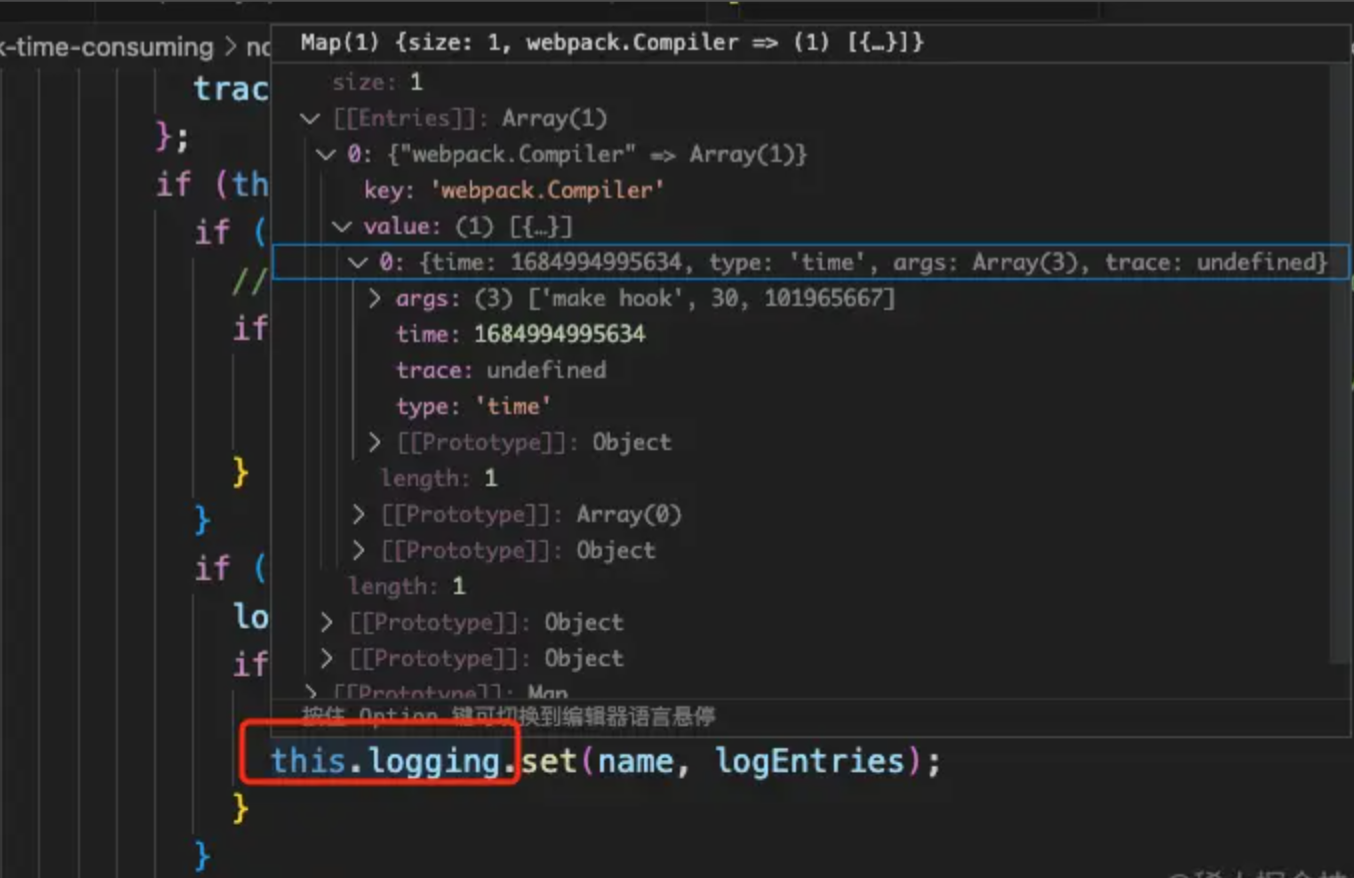
compilation.getLogger代码如下所示
const { Logger, LogType } = require("./logging/Logger");

getLogger(name) {
    /** @type {LogEntry[] | undefined} */
    let logEntries;
    return new Logger(
        (type, args) => {
            const logEntry = {};
            if (this.hooks.log.call(name, logEntry) === undefined) {
                if (logEntries === undefined) {
                    logEntries = this.logging.get(name);
                    if (logEntries === undefined) {
                        logEntries = [];
                        // 将日志信息写到this.logging map对象上,用于后续在stats对象上使用
                        this.logging.set(name, logEntries);
                    }
                }
                logEntries.push(logEntry);
            }
        }
    );
}
const SIMPLE_EXTRACTORS = {
compilation: {
_: (object, compilation, context, options) => {
const { logging, loggingDebug, loggingTrace } = options;
if (logging || (loggingDebug && loggingDebug.length > 0)) {
const util = require("util");
object.logging = {};
let acceptedTypes;
let collapsedGroups = false;
// 通过stats.logging获取logging的值,然后控制最终输出的stats与打印的日志
// 从下面这个swicth可以看出logging=verbose输出的日志是最多的,log其次
switch (logging) {
default:
acceptedTypes = new Set();
break;
case "error":
acceptedTypes = new Set([LogType.error]);
break;
case "warn":
acceptedTypes = new Set([LogType.error, LogType.warn]);
break;
case "info":
acceptedTypes = new Set([
LogType.error,
LogType.warn,
LogType.info
]);
break;
case "log":
acceptedTypes = new Set([
LogType.error,
LogType.warn,
LogType.info,
LogType.log,
LogType.group,
LogType.groupEnd,
LogType.groupCollapsed,
LogType.clear
]);
break;
case "verbose":
acceptedTypes = new Set([
LogType.error,
LogType.warn,
LogType.info,
LogType.log,
LogType.group,
LogType.groupEnd,
LogType.groupCollapsed,
LogType.profile,
LogType.profileEnd,
LogType.time,
LogType.status,
LogType.clear
]);
collapsedGroups = true;
break;
}
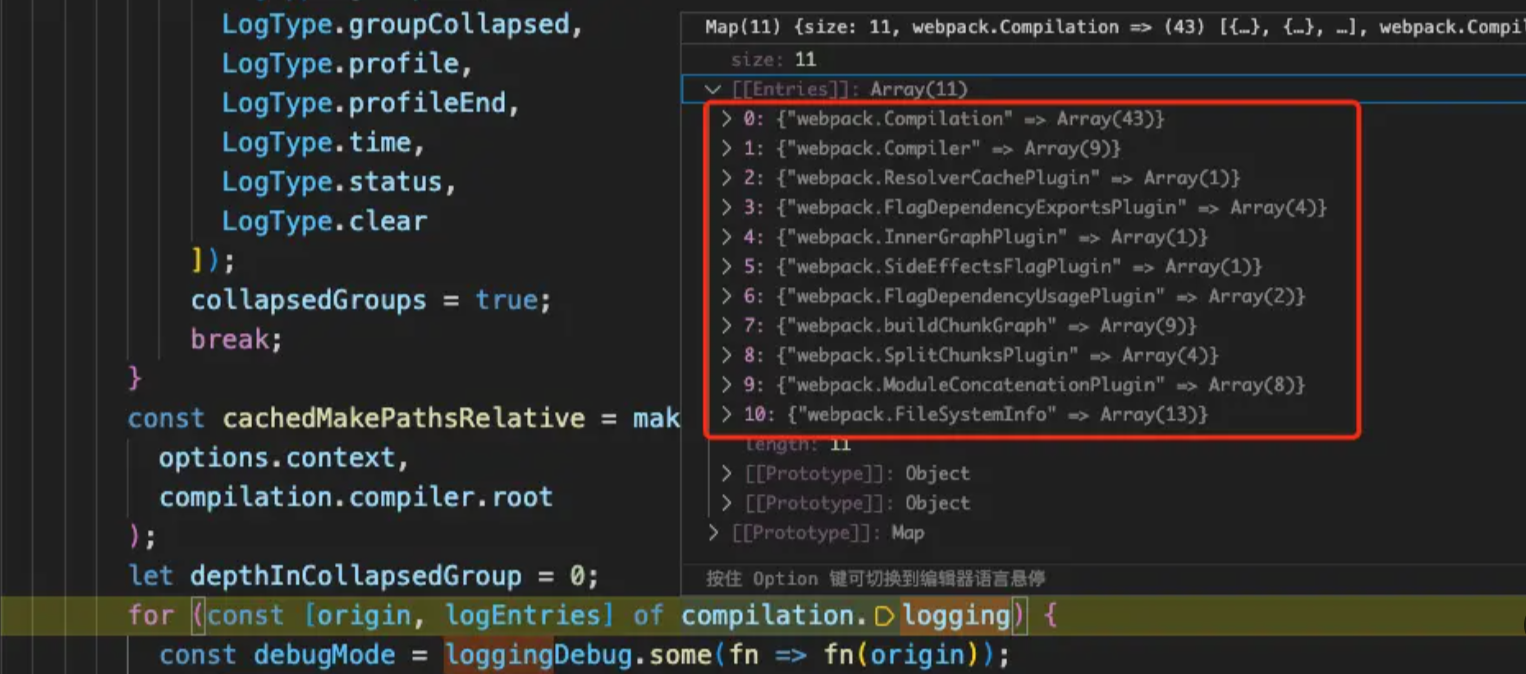
// 读取compilation.logging上的内容,这部分内容就在之前getLogger内写入的
for (const [origin, logEntries] of compilation.logging) {
const debugMode = loggingDebug.some(fn => fn(origin));
if (logging === false && !debugMode) continue;
for (const entry of logEntries) {
let type = entry.type;
// 这里在根据acceptedTypes判断下日志是否需要输出
if (!debugMode && !acceptedTypes.has(type)) continue;
const newEntry = {};
currentList.push(newEntry);
}
// 这个object对象就是最终的stats对象
object.logging[name] = {
entries: rootList,
filteredEntries: logEntries.length - processedLogEntries,
debug: debugMode
};
}
}
},
}
}
 上面的代码串起来就是
- 调用
compilation.getLogger方法获取logger实例 - 调用
logger实例上的timeortimeEnd方法,最终会调用到new Logger传入的callback,然后在这个callback内往this.logging对象上存储日志信息 - 最终在DefaultStatsFactoryplugin.js插件内创建stats的时候,会根据
stats.logging传入的参数,对compilation.logging信息过滤输出,stats.logging默认值是info
从源码上看到infrastructureLogging与stats内部是调用不同日志方法来展示日志的,所以二者不是一样的
总结
要对webpack构建的项目优化,一般有两个思路
- 优化构建时间
- 优化产物大小
而对于构建时间的优化,必然需要统计优化前与优化后的数据,这样才能知道优化的效果,同时也能向上进一步反馈优化成果
通过本篇的学习,我们可以知道webpack中有多种耗时统计方式
- 通过
speed-measure-webpack-plugin插件打印loader与plugin耗时 - 通过
webpack.ProgressPlugin打印webpack内部流程耗时 - 通过
stats.logging打印webpack内部hook耗时
我们在优化项目的时候,可以选择一种或者多种方式来对我们的项目进行分析,以达到最佳效果
FAQ
Error: You forgot to add 'mini-css-extract-plugin' plugin (i.e. { plugins: [new MiniCssExtractplugin()] })
原因:因为mini-css-extract-plugin插件内有通过NormalModule.getCompilationHooks(compilation);获取normalModuleHook,然后在normalModuleHook注册一个callback,并且在callback内修改loaderContext,而mini-css-extract-plugin.loader在执行的时候,又判断了loaderContext是否有对应的属性,如果没有则抛错,代码如下所示
compiler.hooks.compilation.tap(pluginName, compilation => {
  // 获取normalModuleHook,并注册callback
  // 在使用speed-measure-webpack-plugin插件之后,不行的原因是speed-measure-webpack-plugin插件
  // 内代理了compilation,代理了之后通过NormalModule.getCompilationHooks无法获取原始compilation上注册的hook
  // 所以导致在loader内无法获取MiniCssExtractPlugin.pluginSymbol属性
  const {
    loader: normalModuleHook
  } = NormalModule.getCompilationHooks(compilation);

  // 在speed-measure-webpack-plugin包裹场景,因为获取的normalModuleHook不对,导致这段代码不会执行
  normalModuleHook.tap(pluginName,
  loaderContext => {
    loaderContext[pluginSymbol] = {
      experimentalUseImportModule: this.options.experimentalUseImportModule
    };
  });
});
function pitch(request) {
  const optionsFromPlugin = /** @type {TODO} */this[MiniCssExtractPlugin.pluginSymbol];
  if (!optionsFromPlugin) {
    callback(new Error("You forgot to add 'mini-css-extract-plugin' plugin (i.e. `{ plugins: [new MiniCssExtractPlugin()] }`), please read https://github.com/webpack-contrib/mini-css-extract-plugin#getting-started"));
    return;
  }
}
解决方法:目前没有看到好的解决方法,所以采用的是在speed-measure-webpack-plugin包裹之后,在使用mini-css-extract-plugin插件,避免mini-css-extract-plugin插件被处理
const lastCofig = process.env.SPEED_MEASURE ? smp.wrap(config) : config

// MiniCssExtractPlugin不能与SpeedMeasurePlugin一起使用,不然会抛错
config.plugins.push(new MiniCssExtractPlugin(
  {
    filename: 'css/[name].[contenthash].css',
    chunkFilename: 'css/[name].[contenthash].css'
  }
))